|
Aberavon
Labour hold

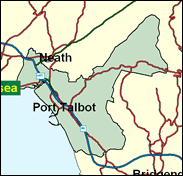
John Morris, Labour's longest established (though not oldest) MP, who can remember serving in previous Labour governments, is retiring at the forthcoming general election after more than 40 years as member for Aberavon. In spite of its Welsh name, this constituency is based on the English speaking town of Port Talbot, made up mainly of the descendants of immigrants from further east who came to work in the heavy industries - typified by the mighty steelworks of Abbey and Margam, which once employed 12,500 workers. Unlike other South Welsh seats, Aberavon resisted the Plaid Cymru challenge in the Welsh Assembly elections in May 1999, granting Labour its fourth highest percentage majority. It will almost certainly be passed on safely to the new candidate, Hywel Francis. This constituency is likely to suffer considerably from the steel industry closures announced by Corus in July 2000.

Former Attorney General Sir John Morris has foregone the chance of becoming Father of the House by quitting after 40 years as MP for Aberavon. His Labour replacement is Hywel Francis, son of the former Welsh minersí leader and founding chairman of the Wales TUC, Dai Francis. A former adviser to Welsh Secretary Paul Murphy, he was born in 1946, educated at secondary schools in Neath and Cardiff, Whitchurch Grammar School, Cardiff, and Swansea University, obtaining a doctorate in History. Currently Professor of Continuing Education at Swansea, he is Vice President of the Welsh Labour History Society, Chairman of the Paul Robeson Cymru Committee and a Trustee of the Bevan Foundation. More than just a typical example of a Welsh Labour candidate reflecting the transition from mining to teaching - from the coal face to the chalk face - he comes from the top drawer of the Welsh Labour establishment, though perhaps too late at the age of 55 to entertain ministerial ambitions.

 |
| Wealthy Achievers, Suburban Areas |
2.40% |
14.99% |
16.04 |
|
| Affluent Greys, Rural Communities |
0.00% |
2.13% |
0.00 |
|
| Prosperous Pensioners, Retirement Areas |
0.00% |
2.49% |
0.00 |
|
| Affluent Executives, Family Areas |
0.73% |
4.43% |
16.53 |
|
| Well-Off Workers, Family Areas |
5.76% |
7.27% |
79.22 |
|
| Affluent Urbanites, Town & City Areas |
0.00% |
2.56% |
0.00 |
|
| Prosperous Professionals, Metropolitan Areas |
0.00% |
2.04% |
0.00 |
|
| Better-Off Executives, Inner City Areas |
0.13% |
3.94% |
3.36 |
|
| Comfortable Middle Agers, Mature Home Owning Areas |
7.88% |
13.04% |
60.45 |
|
| Skilled Workers, Home Owning Areas |
36.35% |
12.70% |
286.19 |
|
| New Home Owners, Mature Communities |
31.27% |
8.14% |
384.06 |
|
| White Collar Workers, Better-Off Multi Ethnic Areas |
0.78% |
4.02% |
19.34 |
|
| Older People, Less Prosperous Areas |
3.48% |
3.19% |
109.14 |
|
| Council Estate Residents, Better-Off Homes |
10.31% |
11.31% |
91.19 |
|
| Council Estate Residents, High Unemployment |
0.67% |
3.06% |
21.98 |
|
| Council Estate Residents, Greatest Hardship |
0.22% |
2.52% |
8.62 |
|
| People in Multi-Ethnic, Low-Income Areas |
0.00% |
2.10% |
0.00 |
|
| Unclassified |
0.00% |
0.06% |
0.00 |
|
|
 |
 |
 |
| £0-5K |
13.05% |
9.41% |
138.62 |
|
| £5-10K |
22.69% |
16.63% |
136.40 |
|
| £10-15K |
20.35% |
16.58% |
122.73 |
|
| £15-20K |
14.64% |
13.58% |
107.78 |
|
| £20-25K |
9.77% |
10.39% |
93.98 |
|
| £25-30K |
6.37% |
7.77% |
81.89 |
|
| £30-35K |
4.14% |
5.79% |
71.54 |
|
| £35-40K |
2.72% |
4.33% |
62.77 |
|
| £40-45K |
1.81% |
3.27% |
55.39 |
|
| £45-50K |
1.22% |
2.48% |
49.16 |
|
| £50-55K |
0.84% |
1.90% |
43.91 |
|
| £55-60K |
0.58% |
1.47% |
39.45 |
|
| £60-65K |
0.41% |
1.15% |
35.66 |
|
| £65-70K |
0.29% |
0.91% |
32.40 |
|
| £70-75K |
0.21% |
0.72% |
29.60 |
|
| £75-80K |
0.16% |
0.57% |
27.17 |
|
| £80-85K |
0.12% |
0.46% |
25.04 |
|
| £85-90K |
0.09% |
0.37% |
23.18 |
|
| £90-95K |
0.07% |
0.31% |
21.54 |
|
| £95-100K |
0.05% |
0.25% |
20.08 |
|
| £100K + |
0.19% |
1.34% |
14.20 |
|
|
|

|


|
1992-1997
|
1997-2001
|
|
|
|
| Con |
-6.02% |
| Lab |
4.22% |
| LD |
-1.16% |
| PC |
1.01% |
|
| Con |
-0.29% |
| Lab |
-8.26% |
| LD |
-1.64% |
| PC |
4.10% |
|
|
 |
Hywel Francis
Labour hold
|
| Con |
 |
2,296 |
7.60% |
| Lab |
 |
19,063 |
63.06% |
| LD |
 |
2,933 |
9.70% |
| PC |
 |
2,995 |
9.91% |
| Oth |
 |
2,943 |
9.74% |
| Maj |
 |
16,068 |
53.15% |
| Turn |
 |
30,230 |
60.87% |
|
|
 |
Hywel Francis
Labour hold
|
| Bean |
Captain Beany |
727 |
2.40% |
| SA |
Martin Chapman |
256 |
0.85% |
| LD |
Chris Davies |
2,933 |
9.70% |
| L |
Hywel Francis |
19,063 |
63.06% |
| C |
Ali Miraj |
2,296 |
7.60% |
| PC |
Lisa Turnbull |
2,995 |
9.91% |
| RP |
Andrew Tutton |
1,960 |
6.48% |
|
Candidates representing 7 parties stood for election to this seat.
|
|
 |
John Morris
Labour
|
| Con |
 |
2,835 |
7.88% |
| Lab |
 |
25,650 |
71.32% |
| LD |
 |
4,079 |
11.34% |
| PC |
 |
2,088 |
5.81% |
| Ref |
 |
970 |
2.70% |
| Oth |
 |
341 |
0.95% |
| Maj |
 |
21,571 |
59.98% |
| Turn |
 |
35,963 |
71.89% |
|
|
 |
|
Labour
|
| Con |
 |
5,567 |
13.90% |
| Lab |
 |
26,877 |
67.10% |
| LD |
 |
4,999 |
12.50% |
| PC |
 |
1,919 |
4.80% |
| Oth |
 |
707 |
1.80% |
| Maj |
 |
21,310 |
53.20% |
| Turn |
 |
40,069 |
77.00% |
|
|
 |
|

|

