|
Alyn & Deeside
Labour hold

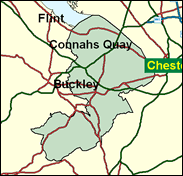
One of only four seats where Labour polled an absolute majority - more than 50pc - of the votes cast in the first Welsh Assembly elections in 1999, it is hard to see from where a challenge might emerge in this predominantly industrial and overwhelmingly English-speaking seat. Situated just over the border from Chester, this seat includes some gritty communities by the Dee such as Queensferry and Connah's Quay, which are not as physically attractive as they sound, as well as some countryside including that around William Ewart Gladstone's estate at Hawarden, where he indulged in much cathartic tree felling during his long political career. This does not betoken a strong Liberal presence in this constituency in the 21st century. The closure of the steelworks at Shotton will not have done the Labour defenders any harm, in electoral terms at least.

Replacing Labour's Barry Jones is Mark Tami who was born in 1962 and educated at Enfield Grammar School and Swansea University. He is now head of policy at the AEEU and was selected in preference to Margaret Hanson, wife of another local Labour MP (see Delyn), amid allegations from retiring Wrexham member John Marek that Barry Jones's late retirement was in order for Millbank to parachute-in a Blairite poodle. Tami comes with a clutch of other union apparatchiks striking lucky as Labour's safe seat selections end, and as a campaigner for retention of jobs at the local BAe and Corus plants. He opposes proportional representation.

 |
| Wealthy Achievers, Suburban Areas |
16.29% |
14.99% |
108.68 |
|
| Affluent Greys, Rural Communities |
0.02% |
2.13% |
0.84 |
|
| Prosperous Pensioners, Retirement Areas |
0.26% |
2.49% |
10.42 |
|
| Affluent Executives, Family Areas |
5.53% |
4.43% |
124.89 |
|
| Well-Off Workers, Family Areas |
20.16% |
7.27% |
277.22 |
|
| Affluent Urbanites, Town & City Areas |
0.00% |
2.56% |
0.00 |
|
| Prosperous Professionals, Metropolitan Areas |
0.00% |
2.04% |
0.00 |
|
| Better-Off Executives, Inner City Areas |
0.03% |
3.94% |
0.68 |
|
| Comfortable Middle Agers, Mature Home Owning Areas |
13.66% |
13.04% |
104.77 |
|
| Skilled Workers, Home Owning Areas |
19.69% |
12.70% |
154.98 |
|
| New Home Owners, Mature Communities |
14.77% |
8.14% |
181.38 |
|
| White Collar Workers, Better-Off Multi Ethnic Areas |
0.76% |
4.02% |
18.95 |
|
| Older People, Less Prosperous Areas |
2.72% |
3.19% |
85.28 |
|
| Council Estate Residents, Better-Off Homes |
5.34% |
11.31% |
47.23 |
|
| Council Estate Residents, High Unemployment |
0.24% |
3.06% |
7.75 |
|
| Council Estate Residents, Greatest Hardship |
0.53% |
2.52% |
21.19 |
|
| People in Multi-Ethnic, Low-Income Areas |
0.00% |
2.10% |
0.00 |
|
| Unclassified |
0.00% |
0.06% |
0.00 |
|
|
 |
 |
 |
| £0-5K |
9.02% |
9.41% |
95.81 |
|
| £5-10K |
17.32% |
16.63% |
104.14 |
|
| £10-15K |
17.78% |
16.58% |
107.26 |
|
| £15-20K |
14.58% |
13.58% |
107.31 |
|
| £20-25K |
10.96% |
10.39% |
105.48 |
|
| £25-30K |
7.97% |
7.77% |
102.57 |
|
| £30-35K |
5.74% |
5.79% |
99.11 |
|
| £35-40K |
4.13% |
4.33% |
95.43 |
|
| £40-45K |
3.00% |
3.27% |
91.74 |
|
| £45-50K |
2.19% |
2.48% |
88.16 |
|
| £50-55K |
1.61% |
1.90% |
84.76 |
|
| £55-60K |
1.20% |
1.47% |
81.56 |
|
| £60-65K |
0.90% |
1.15% |
78.57 |
|
| £65-70K |
0.69% |
0.91% |
75.80 |
|
| £70-75K |
0.53% |
0.72% |
73.23 |
|
| £75-80K |
0.41% |
0.57% |
70.86 |
|
| £80-85K |
0.32% |
0.46% |
68.67 |
|
| £85-90K |
0.25% |
0.37% |
66.64 |
|
| £90-95K |
0.20% |
0.31% |
64.76 |
|
| £95-100K |
0.16% |
0.25% |
63.02 |
|
| £100K + |
0.74% |
1.34% |
54.83 |
|
|
|

|


|
1992-1997
|
1997-2001
|
|
|
|
| Con |
-14.13% |
| Lab |
10.97% |
| LD |
0.02% |
| PC |
0.66% |
|
| Con |
3.49% |
| Lab |
-9.57% |
| LD |
3.23% |
| PC |
1.58% |
|
|
 |
Mark Tami
Labour hold
|
| Con |
 |
9,303 |
26.26% |
| Lab |
 |
18,525 |
52.30% |
| LD |
 |
4,585 |
12.94% |
| PC |
 |
1,182 |
3.34% |
| Oth |
 |
1,826 |
5.16% |
| Maj |
 |
9,222 |
26.04% |
| Turn |
 |
35,421 |
58.57% |
|
|
 |
Mark Tami
Labour hold
|
| G |
Klaus Armstrong-Braun |
881 |
2.49% |
| LD |
Derek Burnham |
4,585 |
12.94% |
| I |
Max Cooksey |
253 |
0.71% |
| PC |
Richard Coombs |
1,182 |
3.34% |
| UK |
William Crawford |
481 |
1.36% |
| CM |
Glyn Davies |
211 |
0.60% |
| C |
Mark Isherwood |
9,303 |
26.26% |
| L |
Mark Tami |
18,525 |
52.30% |
|
Candidates representing 8 parties stood for election to this seat.
|
|
 |
Barry Jones
Labour
|
| Con |
 |
9,552 |
22.77% |
| Lab |
 |
25,955 |
61.87% |
| LD |
 |
4,076 |
9.72% |
| PC |
 |
738 |
1.76% |
| Ref |
 |
1,627 |
3.88% |
| Oth |
|
0 |
0.00% |
| Maj |
 |
16,403 |
39.10% |
| Turn |
 |
41,948 |
72.21% |
|
|
 |
|
Labour
|
| Con |
 |
16,770 |
36.90% |
| Lab |
 |
23,157 |
50.90% |
| LD |
 |
4,431 |
9.70% |
| PC |
 |
517 |
1.10% |
| Oth |
 |
633 |
1.40% |
| Maj |
 |
6,387 |
14.00% |
| Turn |
 |
45,508 |
78.71% |
|
|
 |
|

|

