|
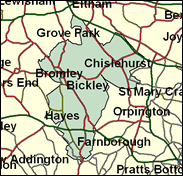
Bromley & Chislehurst
Conservative hold

This is one of only 10 seats that the Conservatives held in London in the 1997 General Election, and it is the third safest of these. In fact the only really solid seat they have left even in the middle class outer south east London Borough of Bromley, which has long been known as one of the three most Tory in the capital along with the upper class west end Kensington / Chelsea, and low tax Wandsworth). The Conservative Eric Forth basically can rely on about half the vote here, and Labour and the Liberal Democrats can get about a quarter each in a good year like 1997.

Eric Forth, a Thatcherite Glaswegian who migrated even further from his former Mid-Worcestershire seat to this one in 1997, has developed an unpopular reputation as a saboteur of Private Members' Bills including even the saintly Sir George Young's attempt to curb the danger of London mini cab drivers. Born 1944 and educated at Jordanhill College School and Glasgow University he sold business machines and computers before coming in on the Thatcher tide of 1983. A root-and-branch Eurosceptic, as an abrasive Trade, then Education, minister before 1997, he was known for his rather flashy "Arthur Daley meets Jimmy Saville" bejewelled appearance. At Education he extolled the virtues of the 5 'Rs' - "reading, riting, rithmetic, right and rong."

 |
| Wealthy Achievers, Suburban Areas |
37.93% |
14.99% |
252.99 |
|
| Affluent Greys, Rural Communities |
0.00% |
2.13% |
0.00 |
|
| Prosperous Pensioners, Retirement Areas |
2.99% |
2.49% |
120.29 |
|
| Affluent Executives, Family Areas |
0.97% |
4.43% |
21.87 |
|
| Well-Off Workers, Family Areas |
0.18% |
7.27% |
2.45 |
|
| Affluent Urbanites, Town & City Areas |
6.09% |
2.56% |
237.28 |
|
| Prosperous Professionals, Metropolitan Areas |
10.68% |
2.04% |
523.18 |
|
| Better-Off Executives, Inner City Areas |
2.29% |
3.94% |
58.17 |
|
| Comfortable Middle Agers, Mature Home Owning Areas |
14.25% |
13.04% |
109.28 |
|
| Skilled Workers, Home Owning Areas |
9.29% |
12.70% |
73.14 |
|
| New Home Owners, Mature Communities |
5.04% |
8.14% |
61.84 |
|
| White Collar Workers, Better-Off Multi Ethnic Areas |
2.51% |
4.02% |
62.51 |
|
| Older People, Less Prosperous Areas |
1.07% |
3.19% |
33.51 |
|
| Council Estate Residents, Better-Off Homes |
6.29% |
11.31% |
55.63 |
|
| Council Estate Residents, High Unemployment |
0.42% |
3.06% |
13.85 |
|
| Council Estate Residents, Greatest Hardship |
0.00% |
2.52% |
0.00 |
|
| People in Multi-Ethnic, Low-Income Areas |
0.00% |
2.10% |
0.00 |
|
| Unclassified |
0.00% |
0.06% |
0.00 |
|
|
 |
 |
 |
| £0-5K |
5.08% |
9.41% |
54.00 |
|
| £5-10K |
9.59% |
16.63% |
57.66 |
|
| £10-15K |
11.42% |
16.58% |
68.89 |
|
| £15-20K |
11.24% |
13.58% |
82.73 |
|
| £20-25K |
10.14% |
10.39% |
97.57 |
|
| £25-30K |
8.76% |
7.77% |
112.63 |
|
| £30-35K |
7.38% |
5.79% |
127.45 |
|
| £35-40K |
6.14% |
4.33% |
141.79 |
|
| £40-45K |
5.08% |
3.27% |
155.50 |
|
| £45-50K |
4.18% |
2.48% |
168.51 |
|
| £50-55K |
3.44% |
1.90% |
180.80 |
|
| £55-60K |
2.84% |
1.47% |
192.37 |
|
| £60-65K |
2.34% |
1.15% |
203.25 |
|
| £65-70K |
1.93% |
0.91% |
213.46 |
|
| £70-75K |
1.60% |
0.72% |
223.05 |
|
| £75-80K |
1.33% |
0.57% |
232.04 |
|
| £80-85K |
1.11% |
0.46% |
240.48 |
|
| £85-90K |
0.93% |
0.37% |
248.40 |
|
| £90-95K |
0.78% |
0.31% |
255.84 |
|
| £95-100K |
0.66% |
0.25% |
262.83 |
|
| £100K + |
4.00% |
1.34% |
297.36 |
|
|
|

|


|
1992-1997
|
1997-2001
|
|
|
|
| Con |
-15.68% |
| Lab |
8.04% |
| LD |
5.96% |
|
| Con |
3.21% |
| Lab |
3.39% |
| LD |
-4.84% |
|
|
 |
Eric Forth
Conservative hold
|
| Con |
 |
21,412 |
49.53% |
| Lab |
 |
12,375 |
28.63% |
| LD |
 |
8,180 |
18.92% |
| Oth |
 |
1,264 |
2.92% |
| Maj |
 |
9,037 |
20.90% |
| Turn |
 |
43,231 |
62.87% |
|
|
 |
Eric Forth
Conservative hold
|
| UK |
Rob Bryant |
1,264 |
2.92% |
| C |
Eric Forth |
21,412 |
49.53% |
| LD |
Geoff Payne |
8,180 |
18.92% |
| L |
Sue Polydorou |
12,375 |
28.63% |
|
Candidates representing 4 parties stood for election to this seat.
|
|
 |
Eric Forth
Conservative
|
| Con |
 |
24,428 |
46.32% |
| Lab |
 |
13,310 |
25.24% |
| LD |
 |
12,530 |
23.76% |
| Ref |
|
0 |
0.00% |
| Oth |
 |
2,470 |
4.68% |
| Maj |
 |
11,118 |
21.08% |
| Turn |
 |
52,738 |
74.17% |
|
|
 |
|
Conservative
|
| Con |
 |
36,028 |
62.00% |
| Lab |
 |
10,027 |
17.20% |
| LD |
 |
10,370 |
17.80% |
| Oth |
 |
1,725 |
3.00% |
| Maj |
 |
25,658 |
44.10% |
| Turn |
 |
58,150 |
78.95% |
|
|
 |
|

|

