|
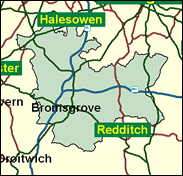
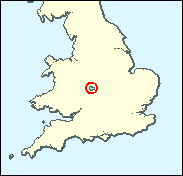
Bromsgrove
Conservative hold

This would have been an extremely close result if Labour had obtained the national average swing in 1997, but Julie Kirkbride did well to hold on to a majority of nearly 5,000 after her party's vote dropped by 7pc. The result, which was one of the Tories' best anywhere and certainly very useful in a potential marginal, is hard to explain. The seat was almost unaltered, so these are genuine figures we are dealing with, not notional results for 1992 in a much changed seat. There was a Referendum candidate, which eliminates another possible cause. Miss Kirkbride was an attractive candidate, but it is hard to quantify the effect of this; conventionally it is argued that personal votes are small, particularly for new MPs. There may be a very local element to the story, as Peter Luff did nearly as well in neighbouring Mid Worcestershire, but both Wyre Forest and Redditch saw double figure drops in the Tory percentage and were lost to Labour. There is some evidence that the Liberal Democrats were not tactically squeezed here as elsewhere in the county and beyond.

Julie Kirkbride, the Conservatives' fake blonde bombshell, won here in 1997, one of a mere handful of new Tory women MPs. A standard orthodox rightwing Eurosceptic she hails from a working class Yorkshire background, born 1960, and rising via grammar school to Girton College, Cambridge and then jobs in TV and on the Telegraph as a much-admired Press Gallery journalist. Variously seen as "toothsome and buxom" and as "firey, forthright and fetching", she married in 1997 as his second wife, fellow MP Andrew Mackay, and has rivalled five of Blair's babes in also producing a babe of her own, Angus, in 2000. Latterly she has worried about the safety of single dose MMR vaccine for babies.

 |
| Wealthy Achievers, Suburban Areas |
37.12% |
14.99% |
247.57 |
|
| Affluent Greys, Rural Communities |
0.00% |
2.13% |
0.00 |
|
| Prosperous Pensioners, Retirement Areas |
1.10% |
2.49% |
44.15 |
|
| Affluent Executives, Family Areas |
7.19% |
4.43% |
162.38 |
|
| Well-Off Workers, Family Areas |
13.50% |
7.27% |
185.58 |
|
| Affluent Urbanites, Town & City Areas |
0.27% |
2.56% |
10.46 |
|
| Prosperous Professionals, Metropolitan Areas |
0.02% |
2.04% |
0.91 |
|
| Better-Off Executives, Inner City Areas |
0.08% |
3.94% |
1.91 |
|
| Comfortable Middle Agers, Mature Home Owning Areas |
18.31% |
13.04% |
140.46 |
|
| Skilled Workers, Home Owning Areas |
7.29% |
12.70% |
57.37 |
|
| New Home Owners, Mature Communities |
7.90% |
8.14% |
97.01 |
|
| White Collar Workers, Better-Off Multi Ethnic Areas |
0.00% |
4.02% |
0.00 |
|
| Older People, Less Prosperous Areas |
1.11% |
3.19% |
34.75 |
|
| Council Estate Residents, Better-Off Homes |
5.46% |
11.31% |
48.27 |
|
| Council Estate Residents, High Unemployment |
0.61% |
3.06% |
19.80 |
|
| Council Estate Residents, Greatest Hardship |
0.00% |
2.52% |
0.00 |
|
| People in Multi-Ethnic, Low-Income Areas |
0.00% |
2.10% |
0.00 |
|
| Unclassified |
0.06% |
0.06% |
100.61 |
|
|
 |
|
|
| £0-5K |
6.07% |
9.41% |
64.45 |
|
| £5-10K |
12.27% |
16.63% |
73.77 |
|
| £10-15K |
14.09% |
16.58% |
84.97 |
|
| £15-20K |
13.02% |
13.58% |
95.83 |
|
| £20-25K |
10.98% |
10.39% |
105.67 |
|
| £25-30K |
8.88% |
7.77% |
114.27 |
|
| £30-35K |
7.05% |
5.79% |
121.64 |
|
| £35-40K |
5.54% |
4.33% |
127.86 |
|
| £40-45K |
4.34% |
3.27% |
133.05 |
|
| £45-50K |
3.41% |
2.48% |
137.34 |
|
| £50-55K |
2.68% |
1.90% |
140.85 |
|
| £55-60K |
2.12% |
1.47% |
143.70 |
|
| £60-65K |
1.68% |
1.15% |
145.98 |
|
| £65-70K |
1.34% |
0.91% |
147.79 |
|
| £70-75K |
1.07% |
0.72% |
149.19 |
|
| £75-80K |
0.86% |
0.57% |
150.25 |
|
| £80-85K |
0.70% |
0.46% |
151.02 |
|
| £85-90K |
0.57% |
0.37% |
151.55 |
|
| £90-95K |
0.46% |
0.31% |
151.86 |
|
| £95-100K |
0.38% |
0.25% |
152.00 |
|
| £100K + |
2.00% |
1.34% |
148.83 |
|
|
|
|


|
1992-1997
|
1997-2001
|
|
|
|
| Con |
-6.94% |
| Lab |
7.08% |
| LD |
-1.92% |
|
| Con |
4.59% |
| Lab |
-3.85% |
| LD |
0.01% |
|
|
|
Julie Kirkbride
Conservative hold
|
| Con |
 |
23,640 |
51.75% |
| Lab |
 |
15,502 |
33.93% |
| LD |
 |
5,430 |
11.89% |
| Oth |
 |
1,112 |
2.43% |
| Maj |
 |
8,138 |
17.81% |
| Turn |
|
45,684 |
67.07% |
|
|
|
Julie Kirkbride
Conservative hold
|
| UK |
Ian Gregory |
1,112 |
2.43% |
| C |
Julie Kirkbride |
23,640 |
51.75% |
| L |
Peter McDonald |
15,502 |
33.93% |
| LD |
Margaret Rowley |
5,430 |
11.89% |
|
Candidates representing 4 parties stood for election to this seat.
|
|
|
Julie Kirkbride
Conservative
|
| Con |
|
24,620 |
47.16% |
| Lab |
|
19,725 |
37.78% |
| LD |
|
6,200 |
11.88% |
| Ref |
 |
1,411 |
2.70% |
| Oth |
|
251 |
0.48% |
| Maj |
|
4,895 |
9.38% |
| Turn |
|
52,207 |
77.07% |
|
|
|
|
Conservative
|
| Con |
|
31,773 |
54.10% |
| Lab |
|
18,021 |
30.70% |
| LD |
|
8,118 |
13.80% |
| Oth |
|
858 |
1.50% |
| Maj |
|
13,752 |
23.40% |
| Turn |
|
58,770 |
82.68% |
|
|
|
|
|