|
Broxbourne
Conservative hold

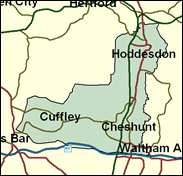
This is a very Conservative seat in the south east corner of Hertfordshire, in the Lea valley just north of the London Borough of Enfield and just across the border from northwest Essex. To generalise, it is affluent but not intellectual: the proportion of those with higher educational qualifications such as university degrees is lower than the national average; in many ways its social profile is more similar to that of Essex constituencies than of other Herts seats. The communities are fairly densely packed along the Liverpool Street to Cambridge rail line: Hoddesdon, Broxbourne itself, Cheshunt, Waltham Cross are the main ones. This is good territory for the Right, and may well swing further that way in 2001.

Marion Roe, a dry-as-dust rightwing loyalist, was elected here in 1983 and was briefly (1987-88) a junior Environment Minister. Inserted into the Health Select Committee chair as a replacement for unreliable maverick Nick Winterton, she backed Redwood in 1997 - even unto his last ditch pact with Ken Clarke. Born 1936 and educated at Bromley and Croydon High Schools she married a Rothschild banker. A campaigner on women's issues such as cancer screening and equal tax treatment for married women, she is traditionalist on working mothers, seeing them as taking out insurance against divorce, and opposes 'abortion on demand.' Latterly she has also opposed mobile phone masts. Somewhat of brassy aspect she is known for her very big hair - a luxuriating bouffant, beehive job held in gravity-defying suspension which last saw service on the late Dusty Springfield (according to Andrew Rawnsley).

 |
| Wealthy Achievers, Suburban Areas |
16.84% |
14.99% |
112.32 |
|
| Affluent Greys, Rural Communities |
0.00% |
2.13% |
0.00 |
|
| Prosperous Pensioners, Retirement Areas |
0.74% |
2.49% |
29.86 |
|
| Affluent Executives, Family Areas |
4.70% |
4.43% |
106.26 |
|
| Well-Off Workers, Family Areas |
17.68% |
7.27% |
243.07 |
|
| Affluent Urbanites, Town & City Areas |
2.86% |
2.56% |
111.54 |
|
| Prosperous Professionals, Metropolitan Areas |
0.67% |
2.04% |
32.76 |
|
| Better-Off Executives, Inner City Areas |
0.00% |
3.94% |
0.00 |
|
| Comfortable Middle Agers, Mature Home Owning Areas |
14.36% |
13.04% |
110.09 |
|
| Skilled Workers, Home Owning Areas |
22.01% |
12.70% |
173.29 |
|
| New Home Owners, Mature Communities |
5.77% |
8.14% |
70.84 |
|
| White Collar Workers, Better-Off Multi Ethnic Areas |
0.62% |
4.02% |
15.36 |
|
| Older People, Less Prosperous Areas |
3.30% |
3.19% |
103.64 |
|
| Council Estate Residents, Better-Off Homes |
8.95% |
11.31% |
79.16 |
|
| Council Estate Residents, High Unemployment |
1.50% |
3.06% |
48.86 |
|
| Council Estate Residents, Greatest Hardship |
0.00% |
2.52% |
0.00 |
|
| People in Multi-Ethnic, Low-Income Areas |
0.00% |
2.10% |
0.00 |
|
| Unclassified |
0.00% |
0.06% |
0.00 |
|
|
 |
 |
 |
| £0-5K |
5.54% |
9.41% |
58.81 |
|
| £5-10K |
11.49% |
16.63% |
69.09 |
|
| £10-15K |
13.64% |
16.58% |
82.26 |
|
| £15-20K |
12.93% |
13.58% |
95.18 |
|
| £20-25K |
11.10% |
10.39% |
106.79 |
|
| £25-30K |
9.08% |
7.77% |
116.85 |
|
| £30-35K |
7.26% |
5.79% |
125.38 |
|
| £35-40K |
5.74% |
4.33% |
132.54 |
|
| £40-45K |
4.52% |
3.27% |
138.52 |
|
| £45-50K |
3.56% |
2.48% |
143.49 |
|
| £50-55K |
2.81% |
1.90% |
147.63 |
|
| £55-60K |
2.23% |
1.47% |
151.07 |
|
| £60-65K |
1.77% |
1.15% |
153.94 |
|
| £65-70K |
1.42% |
0.91% |
156.32 |
|
| £70-75K |
1.14% |
0.72% |
158.31 |
|
| £75-80K |
0.92% |
0.57% |
159.96 |
|
| £80-85K |
0.75% |
0.46% |
161.34 |
|
| £85-90K |
0.61% |
0.37% |
162.48 |
|
| £90-95K |
0.50% |
0.31% |
163.42 |
|
| £95-100K |
0.41% |
0.25% |
164.20 |
|
| £100K + |
2.23% |
1.34% |
165.61 |
|
|
|

|


|
1992-1997
|
1997-2001
|
|
|
|
| Con |
-13.44% |
| Lab |
13.30% |
| LD |
-4.70% |
|
| Con |
6.52% |
| Lab |
-3.63% |
| LD |
-0.06% |
|
|
 |
Marion Roe
Conservative hold
|
| Con |
 |
20,487 |
55.37% |
| Lab |
 |
11,494 |
31.07% |
| LD |
 |
4,158 |
11.24% |
| Oth |
 |
858 |
2.32% |
| Maj |
 |
8,993 |
24.31% |
| Turn |
 |
36,997 |
53.63% |
|
|
 |
Marion Roe
Conservative hold
|
| LD |
Julia Davies |
4,158 |
11.24% |
| UK |
Martin Harvey |
858 |
2.32% |
| L |
David Prendergast |
11,494 |
31.07% |
| C |
Marion Roe |
20,487 |
55.37% |
|
Candidates representing 4 parties stood for election to this seat.
|
|
 |
Marion Roe
Conservative
|
| Con |
 |
22,952 |
48.86% |
| Lab |
 |
16,299 |
34.70% |
| LD |
 |
5,310 |
11.30% |
| Ref |
 |
1,633 |
3.48% |
| Oth |
 |
782 |
1.66% |
| Maj |
 |
6,653 |
14.16% |
| Turn |
 |
46,976 |
70.41% |
|
|
 |
|
Conservative
|
| Con |
 |
32,518 |
62.30% |
| Lab |
 |
11,168 |
21.40% |
| LD |
 |
8,353 |
16.00% |
| Oth |
 |
181 |
0.30% |
| Maj |
 |
21,350 |
40.90% |
| Turn |
 |
52,220 |
79.05% |
|
|
 |
|

|

