|
Broxtowe
Labour hold

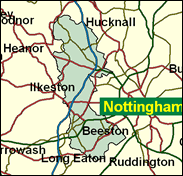
If Labour does not achieve an overall majority of at least 70 in the next General Election, they are likely to lose Broxtowe, in the suburbs to the west of Nottingham. This makes it a key marginal, and a probable "close-run thing", as the Duke of Wellington might have said. There are a number of communities here, led in numbers by Beeston and Stapleford, and including Bramcote, Chilwell, Toton, Attenborough and Kimberley (as in ale, not diamonds), and not many villages. Although close to the main Nottingham University campus, the overall tone is residential and suburban middle class.

Nick Palmer, a quiet Labour loyalist elected on the 1997 floodtide is a computer scientist (previously with Ciba-Geigy) who is keen on animal welfare, mandatory bells on bikes, same-day acknowledgement of business letters and - inevitably - more internet use. Born 1950, educated in Denmark and Austria and with a Maths doctorate from London University, he is probably - as a member of the Cleft Palate Association - the first MP to overcome such a disability. His potential Tory nemesis comes in the shape of Pauline Latham. Born 1948, educated at Bramcote Hills Technical Grammar School, she is a campaigner for grant maintained schools. Leader of the Conservatives on Derby City Council, and one-time shop assistant who later ran her own catering business, she is married to an architect.

 |
| Wealthy Achievers, Suburban Areas |
19.77% |
14.99% |
131.84 |
|
| Affluent Greys, Rural Communities |
0.00% |
2.13% |
0.00 |
|
| Prosperous Pensioners, Retirement Areas |
2.47% |
2.49% |
99.43 |
|
| Affluent Executives, Family Areas |
9.08% |
4.43% |
205.15 |
|
| Well-Off Workers, Family Areas |
11.59% |
7.27% |
159.40 |
|
| Affluent Urbanites, Town & City Areas |
0.82% |
2.56% |
32.02 |
|
| Prosperous Professionals, Metropolitan Areas |
0.37% |
2.04% |
18.31 |
|
| Better-Off Executives, Inner City Areas |
0.51% |
3.94% |
13.06 |
|
| Comfortable Middle Agers, Mature Home Owning Areas |
19.27% |
13.04% |
147.80 |
|
| Skilled Workers, Home Owning Areas |
16.12% |
12.70% |
126.90 |
|
| New Home Owners, Mature Communities |
7.44% |
8.14% |
91.39 |
|
| White Collar Workers, Better-Off Multi Ethnic Areas |
2.84% |
4.02% |
70.50 |
|
| Older People, Less Prosperous Areas |
4.17% |
3.19% |
130.96 |
|
| Council Estate Residents, Better-Off Homes |
4.00% |
11.31% |
35.36 |
|
| Council Estate Residents, High Unemployment |
0.65% |
3.06% |
21.12 |
|
| Council Estate Residents, Greatest Hardship |
0.85% |
2.52% |
33.76 |
|
| People in Multi-Ethnic, Low-Income Areas |
0.02% |
2.10% |
1.14 |
|
| Unclassified |
0.02% |
0.06% |
28.31 |
|
|
 |
 |
 |
| £0-5K |
9.25% |
9.41% |
98.28 |
|
| £5-10K |
17.29% |
16.63% |
103.98 |
|
| £10-15K |
17.48% |
16.58% |
105.44 |
|
| £15-20K |
14.24% |
13.58% |
104.85 |
|
| £20-25K |
10.73% |
10.39% |
103.22 |
|
| £25-30K |
7.86% |
7.77% |
101.08 |
|
| £30-35K |
5.72% |
5.79% |
98.73 |
|
| £35-40K |
4.17% |
4.33% |
96.34 |
|
| £40-45K |
3.07% |
3.27% |
93.99 |
|
| £45-50K |
2.28% |
2.48% |
91.72 |
|
| £50-55K |
1.71% |
1.90% |
89.54 |
|
| £55-60K |
1.29% |
1.47% |
87.47 |
|
| £60-65K |
0.98% |
1.15% |
85.49 |
|
| £65-70K |
0.76% |
0.91% |
83.62 |
|
| £70-75K |
0.59% |
0.72% |
81.84 |
|
| £75-80K |
0.46% |
0.57% |
80.14 |
|
| £80-85K |
0.36% |
0.46% |
78.53 |
|
| £85-90K |
0.29% |
0.37% |
76.99 |
|
| £90-95K |
0.23% |
0.31% |
75.52 |
|
| £95-100K |
0.19% |
0.25% |
74.11 |
|
| £100K + |
0.89% |
1.34% |
66.13 |
|
|
|

|


|
1992-1997
|
1997-2001
|
|
|
|
| Con |
-13.56% |
| Lab |
12.23% |
| LD |
-1.87% |
|
| Con |
-0.79% |
| Lab |
1.61% |
| LD |
2.78% |
|
|
 |
Nick Palmer
Labour hold
|
| Con |
 |
17,963 |
36.66% |
| Lab |
 |
23,836 |
48.64% |
| LD |
 |
7,205 |
14.70% |
| Oth |
|
0 |
0.00% |
| Maj |
 |
5,873 |
11.98% |
| Turn |
 |
49,004 |
66.51% |
|
|
 |
Nick Palmer
Labour hold
|
| C |
Pauline Latham |
17,963 |
36.66% |
| L |
Nick Palmer |
23,836 |
48.64% |
| LD |
David Watts |
7,205 |
14.70% |
|
Candidates representing 3 parties stood for election to this seat.
|
|
 |
Nick Palmer
Labour gain
|
| Con |
 |
21,768 |
37.44% |
| Lab |
 |
27,343 |
47.03% |
| LD |
 |
6,934 |
11.93% |
| Ref |
 |
2,092 |
3.60% |
| Oth |
|
0 |
0.00% |
| Maj |
 |
5,575 |
9.59% |
| Turn |
 |
58,137 |
78.41% |
|
|
 |
|
Conservative
|
| Con |
 |
31,033 |
51.00% |
| Lab |
 |
21,162 |
34.80% |
| LD |
 |
8,378 |
13.80% |
| Oth |
 |
293 |
0.50% |
| Maj |
 |
9,871 |
16.20% |
| Turn |
 |
60,866 |
82.53% |
|
|
 |
|

|

