|
Buckingham
Conservative hold

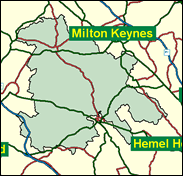
Buckingham is the 12th safest Tory seat. As befits the site of Britain's first private university, the town itself is very Conservative, and although it grew rapidly in the 1980s it still has a population of only 11,000. The many villages here in that part of north Buckinghamshire not submerged by Milton Keynes are also Tory: Brill with its windmill, and Great Brickhill, Great Horwood and Grendon Underwood, Long Crendon and Marsh Gibbon and Newton Longville, Quainton, Wing and Wingrave and Winslow. It all sounds like a list for Flanders and Swann's The Slow Train, and indeed some sleepy railway lines do still operate in this peaceful neck of the woods. John Bercow obtained nigh on 50pc of the vote even in 1997, more or less an absolute majority and certainly more than both his main opponents put together.

John Bercow, elected in 1997, is on the Conservatives' Home Office team. A sallow-skinned, pint-sized, highly partisan son of a Jewish taxi driver and car salesman, he was born 1963 and educated at Finchley Manorhill School and Essex University. A former political consultant with Saatchi and a very Eurosceptic Thatcherite, his reputation is for having only his hair parted in the centre. Seen by Lord Parkinson as a "tremendous street fighter," he is one of the few Tories who vote for homosexual sex at 16, has a highly accomplished, fluent style as a Commons debater, and - for all his abrasiveness - is now seen as travelling with Michael Portillo towards a more electable terrain.

 |
| Wealthy Achievers, Suburban Areas |
53.39% |
14.99% |
356.08 |
|
| Affluent Greys, Rural Communities |
0.74% |
2.13% |
34.94 |
|
| Prosperous Pensioners, Retirement Areas |
0.10% |
2.49% |
3.92 |
|
| Affluent Executives, Family Areas |
13.73% |
4.43% |
310.31 |
|
| Well-Off Workers, Family Areas |
8.24% |
7.27% |
113.23 |
|
| Affluent Urbanites, Town & City Areas |
0.23% |
2.56% |
8.88 |
|
| Prosperous Professionals, Metropolitan Areas |
0.00% |
2.04% |
0.00 |
|
| Better-Off Executives, Inner City Areas |
1.91% |
3.94% |
48.39 |
|
| Comfortable Middle Agers, Mature Home Owning Areas |
14.72% |
13.04% |
112.88 |
|
| Skilled Workers, Home Owning Areas |
0.74% |
12.70% |
5.81 |
|
| New Home Owners, Mature Communities |
4.65% |
8.14% |
57.08 |
|
| White Collar Workers, Better-Off Multi Ethnic Areas |
0.04% |
4.02% |
0.93 |
|
| Older People, Less Prosperous Areas |
1.04% |
3.19% |
32.60 |
|
| Council Estate Residents, Better-Off Homes |
0.00% |
11.31% |
0.00 |
|
| Council Estate Residents, High Unemployment |
0.00% |
3.06% |
0.00 |
|
| Council Estate Residents, Greatest Hardship |
0.45% |
2.52% |
17.99 |
|
| People in Multi-Ethnic, Low-Income Areas |
0.00% |
2.10% |
0.00 |
|
| Unclassified |
0.03% |
0.06% |
52.69 |
|
|
 |
 |
 |
| £0-5K |
4.10% |
9.41% |
43.60 |
|
| £5-10K |
9.24% |
16.63% |
55.56 |
|
| £10-15K |
11.68% |
16.58% |
70.46 |
|
| £15-20K |
11.71% |
13.58% |
86.21 |
|
| £20-25K |
10.58% |
10.39% |
101.76 |
|
| £25-30K |
9.06% |
7.77% |
116.60 |
|
| £30-35K |
7.56% |
5.79% |
130.51 |
|
| £35-40K |
6.21% |
4.33% |
143.40 |
|
| £40-45K |
5.07% |
3.27% |
155.26 |
|
| £45-50K |
4.12% |
2.48% |
166.16 |
|
| £50-55K |
3.35% |
1.90% |
176.16 |
|
| £55-60K |
2.73% |
1.47% |
185.34 |
|
| £60-65K |
2.23% |
1.15% |
193.79 |
|
| £65-70K |
1.83% |
0.91% |
201.57 |
|
| £70-75K |
1.50% |
0.72% |
208.77 |
|
| £75-80K |
1.24% |
0.57% |
215.45 |
|
| £80-85K |
1.03% |
0.46% |
221.66 |
|
| £85-90K |
0.85% |
0.37% |
227.45 |
|
| £90-95K |
0.71% |
0.31% |
232.87 |
|
| £95-100K |
0.59% |
0.25% |
237.97 |
|
| £100K + |
3.56% |
1.34% |
264.96 |
|
|
|

|


|
1992-1997
|
1997-2001
|
|
|
|
| Con |
-12.51% |
| Lab |
8.61% |
| LD |
3.75% |
|
| Con |
3.88% |
| Lab |
-0.48% |
| LD |
-4.69% |
|
|
 |
John Bercow
Conservative hold
|
| Con |
 |
24,296 |
53.67% |
| Lab |
 |
10,971 |
24.23% |
| LD |
 |
9,037 |
19.96% |
| Oth |
 |
968 |
2.14% |
| Maj |
 |
13,325 |
29.43% |
| Turn |
 |
45,272 |
69.36% |
|
|
 |
John Bercow
Conservative hold
|
| C |
John Bercow |
24,296 |
53.67% |
| L |
Mark Seddon |
10,971 |
24.23% |
| UK |
Christopher Silcock |
968 |
2.14% |
| LD |
Isobel Wilson |
9,037 |
19.96% |
|
Candidates representing 4 parties stood for election to this seat.
|
|
 |
John Bercow
Conservative
|
| Con |
 |
24,594 |
49.79% |
| Lab |
 |
12,208 |
24.71% |
| LD |
 |
12,175 |
24.65% |
| Ref |
|
0 |
0.00% |
| Oth |
 |
421 |
0.85% |
| Maj |
 |
12,386 |
25.07% |
| Turn |
 |
49,398 |
78.48% |
|
|
 |
|
Conservative
|
| Con |
 |
31,045 |
62.30% |
| Lab |
 |
7,999 |
16.10% |
| LD |
 |
10,401 |
20.90% |
| Oth |
 |
391 |
0.80% |
| Maj |
 |
20,644 |
41.40% |
| Turn |
 |
49,836 |
83.71% |
|
|
 |
|

|

