|
Burnley
Labour hold

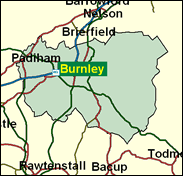
Safely Labour since 1935, Burnley gave Peter Pike a majority of 17,000 in 1997. In the May 2000 local elections, although Labour were plagued by a rash of Independents, the Conservatives could only win a single ward, Whittlefield with Ightenhill, and the Liberal Democrats also only Briercliffe, and Coal Clough with Deerplay. Labour did win every county council electoral division on the same day as the last General Election though, so in the long term they have no weak areas in this industrial town where the textile and mining bases declined in the 1960s but have been replaced by a range of diverse sources of employment ranging from high technology to motor vehicle exhausts. No wonder the PM's powerful press secretary and fellow architect of New Labour Alastair Campbell supports Burnley Football Club, the Clarets.

Peter Pike, a big, shambling, bucolic-looking man, has been Labour MP here since 1983, but looks as if he could just as easily be mucking out a pigsty somewhere in Wessex. Born 1937 and educated at secondary modern schools in the Surrey suburbs and at Kingston technical college, he worked variously as a bank clerk, Labour Party agent and final inspector at Mullards factory in Burnley. A Worzel-Gummidge lookalike, he backed the Eurosceptic Gould for leader in 1992 and Beckett not Blair in 1994, and exited promptly from the front bench. He was passed over in 1997 even for the non-job of Second Church Estates Commissioner on account of the disapproval of the style consultants.

 |
| Wealthy Achievers, Suburban Areas |
4.58% |
14.99% |
30.53 |
|
| Affluent Greys, Rural Communities |
0.03% |
2.13% |
1.56 |
|
| Prosperous Pensioners, Retirement Areas |
0.00% |
2.49% |
0.00 |
|
| Affluent Executives, Family Areas |
4.82% |
4.43% |
108.82 |
|
| Well-Off Workers, Family Areas |
12.49% |
7.27% |
171.72 |
|
| Affluent Urbanites, Town & City Areas |
0.00% |
2.56% |
0.00 |
|
| Prosperous Professionals, Metropolitan Areas |
0.00% |
2.04% |
0.00 |
|
| Better-Off Executives, Inner City Areas |
0.72% |
3.94% |
18.37 |
|
| Comfortable Middle Agers, Mature Home Owning Areas |
6.02% |
13.04% |
46.17 |
|
| Skilled Workers, Home Owning Areas |
37.58% |
12.70% |
295.81 |
|
| New Home Owners, Mature Communities |
7.39% |
8.14% |
90.77 |
|
| White Collar Workers, Better-Off Multi Ethnic Areas |
0.48% |
4.02% |
11.98 |
|
| Older People, Less Prosperous Areas |
3.67% |
3.19% |
115.27 |
|
| Council Estate Residents, Better-Off Homes |
15.65% |
11.31% |
138.35 |
|
| Council Estate Residents, High Unemployment |
1.49% |
3.06% |
48.59 |
|
| Council Estate Residents, Greatest Hardship |
3.06% |
2.52% |
121.51 |
|
| People in Multi-Ethnic, Low-Income Areas |
2.02% |
2.10% |
96.29 |
|
| Unclassified |
0.00% |
0.06% |
0.00 |
|
|
 |
 |
 |
| £0-5K |
11.76% |
9.41% |
124.96 |
|
| £5-10K |
20.64% |
16.63% |
124.08 |
|
| £10-15K |
19.19% |
16.58% |
115.76 |
|
| £15-20K |
14.41% |
13.58% |
106.08 |
|
| £20-25K |
10.08% |
10.39% |
96.99 |
|
| £25-30K |
6.92% |
7.77% |
88.95 |
|
| £30-35K |
4.75% |
5.79% |
81.96 |
|
| £35-40K |
3.29% |
4.33% |
75.90 |
|
| £40-45K |
2.31% |
3.27% |
70.63 |
|
| £45-50K |
1.64% |
2.48% |
66.03 |
|
| £50-55K |
1.18% |
1.90% |
61.99 |
|
| £55-60K |
0.86% |
1.47% |
58.42 |
|
| £60-65K |
0.64% |
1.15% |
55.25 |
|
| £65-70K |
0.48% |
0.91% |
52.41 |
|
| £70-75K |
0.36% |
0.72% |
49.86 |
|
| £75-80K |
0.27% |
0.57% |
47.55 |
|
| £80-85K |
0.21% |
0.46% |
45.46 |
|
| £85-90K |
0.16% |
0.37% |
43.54 |
|
| £90-95K |
0.13% |
0.31% |
41.78 |
|
| £95-100K |
0.10% |
0.25% |
40.17 |
|
| £100K + |
0.44% |
1.34% |
32.41 |
|
|
|

|


|
1992-1997
|
1997-2001
|
|
|
|
| Con |
-10.38% |
| Lab |
4.93% |
| LD |
1.01% |
|
| Con |
0.65% |
| Lab |
-8.60% |
| LD |
-1.21% |
|
|
 |
Peter Pike
Labour hold
|
| Con |
 |
7,697 |
20.87% |
| Lab |
 |
18,195 |
49.33% |
| LD |
 |
5,975 |
16.20% |
| Oth |
 |
5,017 |
13.60% |
| Maj |
 |
10,498 |
28.46% |
| Turn |
 |
36,884 |
55.55% |
|
|
 |
Peter Pike
Labour hold
|
| UK |
Richard Buttrey |
866 |
2.35% |
| C |
Robert Frost |
7,697 |
20.87% |
| L |
Peter Pike |
18,195 |
49.33% |
| BNP |
Steven Smith |
4,151 |
11.25% |
| LD |
Paul Wright |
5,975 |
16.20% |
|
Candidates representing 5 parties stood for election to this seat.
|
|
 |
Peter Pike
Labour
|
| Con |
 |
9,148 |
20.22% |
| Lab |
 |
26,210 |
57.93% |
| LD |
 |
7,877 |
17.41% |
| Ref |
 |
2,010 |
4.44% |
| Oth |
|
0 |
0.00% |
| Maj |
 |
17,062 |
37.71% |
| Turn |
 |
45,245 |
66.95% |
|
|
 |
|
Labour
|
| Con |
 |
15,693 |
30.60% |
| Lab |
 |
27,184 |
53.00% |
| LD |
 |
8,414 |
16.40% |
| Oth |
|
0 |
0.00% |
| Maj |
 |
11,491 |
22.40% |
| Turn |
 |
51,291 |
74.15% |
|
|
 |
|

|

