|
Burton
Labour hold

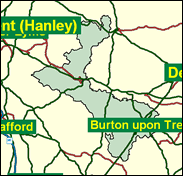
If the Tories do not regain this seat, which they held continuously from 1950 to 1997, on a six per cent swing, their chances of knocking out Labour's national overall majority are slim. They will, indeed, have "gone for a Burton" in this vital marginal in east Staffordshire, close to the Derbyshire border. Labour traditionally has done well in the brewing town of Burton itself, but the Conservatives fight back in the countryside running up to Uttoxeter. The person with the task of removing Janet Dean is one of the relatively few female Conservatives with a hope of becoming an MP next time, Maggie Punyer.

Janet Dean, Labour's first-ever winner here in 1997 and a first-time parliamentary candidate, came courtesy of an all-women's shortlist. Born 1949 and educated at Winsford Verdin County Grammar School, she had nevertheless 16 years' experience on Derbyshire County Council and six years on the local District Council. Less a Blair's Babe than a Blair's Granny, she has not much troubled the scorers in four years - but did rebel in 2000 over the proposed sell-off of air traffic control, a matter of some local concern with the proximity of East Midlands Airport. Her would-be Tory nemesis is Maggie Punyer, a conference organiser, born 1952 and educated at The Study, Wimbledon, who trained inconclusively as a teacher at Southlands College, Wimbledon, and has insisted on being listed as "Eurosceptic" in the Telegraph.

 |
| Wealthy Achievers, Suburban Areas |
13.78% |
14.99% |
91.90 |
|
| Affluent Greys, Rural Communities |
1.74% |
2.13% |
82.02 |
|
| Prosperous Pensioners, Retirement Areas |
0.27% |
2.49% |
10.73 |
|
| Affluent Executives, Family Areas |
5.11% |
4.43% |
115.47 |
|
| Well-Off Workers, Family Areas |
9.96% |
7.27% |
136.98 |
|
| Affluent Urbanites, Town & City Areas |
0.00% |
2.56% |
0.00 |
|
| Prosperous Professionals, Metropolitan Areas |
0.00% |
2.04% |
0.00 |
|
| Better-Off Executives, Inner City Areas |
0.02% |
3.94% |
0.59 |
|
| Comfortable Middle Agers, Mature Home Owning Areas |
12.99% |
13.04% |
99.59 |
|
| Skilled Workers, Home Owning Areas |
26.92% |
12.70% |
211.91 |
|
| New Home Owners, Mature Communities |
8.54% |
8.14% |
104.81 |
|
| White Collar Workers, Better-Off Multi Ethnic Areas |
1.85% |
4.02% |
45.89 |
|
| Older People, Less Prosperous Areas |
3.09% |
3.19% |
96.85 |
|
| Council Estate Residents, Better-Off Homes |
13.25% |
11.31% |
117.12 |
|
| Council Estate Residents, High Unemployment |
0.45% |
3.06% |
14.56 |
|
| Council Estate Residents, Greatest Hardship |
1.67% |
2.52% |
66.25 |
|
| People in Multi-Ethnic, Low-Income Areas |
0.36% |
2.10% |
17.20 |
|
| Unclassified |
0.02% |
0.06% |
37.13 |
|
|
 |
 |
 |
| £0-5K |
11.22% |
9.41% |
119.24 |
|
| £5-10K |
19.04% |
16.63% |
114.48 |
|
| £10-15K |
18.03% |
16.58% |
108.78 |
|
| £15-20K |
14.01% |
13.58% |
103.17 |
|
| £20-25K |
10.18% |
10.39% |
97.93 |
|
| £25-30K |
7.24% |
7.77% |
93.15 |
|
| £30-35K |
5.14% |
5.79% |
88.83 |
|
| £35-40K |
3.68% |
4.33% |
84.91 |
|
| £40-45K |
2.66% |
3.27% |
81.37 |
|
| £45-50K |
1.94% |
2.48% |
78.16 |
|
| £50-55K |
1.43% |
1.90% |
75.24 |
|
| £55-60K |
1.07% |
1.47% |
72.58 |
|
| £60-65K |
0.81% |
1.15% |
70.15 |
|
| £65-70K |
0.62% |
0.91% |
67.91 |
|
| £70-75K |
0.47% |
0.72% |
65.84 |
|
| £75-80K |
0.37% |
0.57% |
63.94 |
|
| £80-85K |
0.29% |
0.46% |
62.16 |
|
| £85-90K |
0.23% |
0.37% |
60.52 |
|
| £90-95K |
0.18% |
0.31% |
58.98 |
|
| £95-100K |
0.14% |
0.25% |
57.54 |
|
| £100K + |
0.67% |
1.34% |
50.17 |
|
|
|

|


|
1992-1997
|
1997-2001
|
|
|
|
| Con |
-8.80% |
| Lab |
9.82% |
| LD |
-2.03% |
|
| Con |
-0.80% |
| Lab |
-1.98% |
| LD |
1.15% |
|
|
 |
Janet Dean
Labour hold
|
| Con |
 |
17,934 |
38.60% |
| Lab |
 |
22,783 |
49.04% |
| LD |
 |
4,468 |
9.62% |
| Oth |
 |
1,272 |
2.74% |
| Maj |
 |
4,849 |
10.44% |
| Turn |
 |
46,457 |
61.78% |
|
|
 |
Janet Dean
Labour hold
|
| UK |
Ian Crompton |
984 |
2.12% |
| L |
Janet Dean |
22,783 |
49.04% |
| LD |
David Fletcher |
4,468 |
9.62% |
| C |
Maggie Punyer |
17,934 |
38.60% |
| P |
John Taylor |
288 |
0.62% |
|
Candidates representing 5 parties stood for election to this seat.
|
|
 |
Janet Dean
Labour gain
|
| Con |
 |
21,480 |
39.40% |
| Lab |
 |
27,810 |
51.02% |
| LD |
 |
4,617 |
8.47% |
| Ref |
|
0 |
0.00% |
| Oth |
 |
604 |
1.11% |
| Maj |
 |
6,330 |
11.61% |
| Turn |
 |
54,511 |
75.08% |
|
|
 |
|
Conservative
|
| Con |
 |
28,454 |
48.20% |
| Lab |
 |
24,327 |
41.20% |
| LD |
 |
6,219 |
10.50% |
| Oth |
|
0 |
0.00% |
| Maj |
 |
4,127 |
7.00% |
| Turn |
 |
59,000 |
81.67% |
|
|
 |
|

|

