|
Bury North
Labour hold

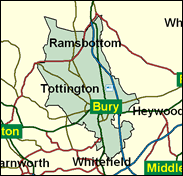
Both Bury seats have usually been regarded as marginal. However, North requires a pro-Conservative swing of over 6 per cent and South of over 12pc, which really must take it right out of that category. Even the task in Bury North is going to be hard going for new Tory candidate John Walsh. The Conservative candidates in the May 2000 local election wards which make up the seat, mainly in Bury itself but also in the affluent commuterdom of Tottington and Ramsbottom, were only just ahead of their Labour counterparts in votes, in what may well be an anomalously good year for the party by recent - and possible future - standards.

David Chaytor - a rugged lantern-jawed ex-adult education lecturer, born 1949, locally educated at Bury Grammar School, Huddersfield Polytechnic and Bradford University, won here in 1997, having been forced out of Calder Valley by an all-women shortlist. Arriving too old for office, he joined the first rebellion against lone parent benefit cuts in December 1997 and turned up again for the later revolts on means testing disability benefits and air traffic control sell-off.

 |
| Wealthy Achievers, Suburban Areas |
13.94% |
14.99% |
92.94 |
|
| Affluent Greys, Rural Communities |
0.00% |
2.13% |
0.00 |
|
| Prosperous Pensioners, Retirement Areas |
0.60% |
2.49% |
24.16 |
|
| Affluent Executives, Family Areas |
8.79% |
4.43% |
198.56 |
|
| Well-Off Workers, Family Areas |
14.18% |
7.27% |
194.99 |
|
| Affluent Urbanites, Town & City Areas |
0.11% |
2.56% |
4.34 |
|
| Prosperous Professionals, Metropolitan Areas |
0.00% |
2.04% |
0.00 |
|
| Better-Off Executives, Inner City Areas |
0.38% |
3.94% |
9.59 |
|
| Comfortable Middle Agers, Mature Home Owning Areas |
10.29% |
13.04% |
78.93 |
|
| Skilled Workers, Home Owning Areas |
27.31% |
12.70% |
215.03 |
|
| New Home Owners, Mature Communities |
6.82% |
8.14% |
83.70 |
|
| White Collar Workers, Better-Off Multi Ethnic Areas |
1.23% |
4.02% |
30.49 |
|
| Older People, Less Prosperous Areas |
2.06% |
3.19% |
64.71 |
|
| Council Estate Residents, Better-Off Homes |
11.05% |
11.31% |
97.70 |
|
| Council Estate Residents, High Unemployment |
0.67% |
3.06% |
21.82 |
|
| Council Estate Residents, Greatest Hardship |
2.20% |
2.52% |
87.21 |
|
| People in Multi-Ethnic, Low-Income Areas |
0.38% |
2.10% |
18.05 |
|
| Unclassified |
0.00% |
0.06% |
0.00 |
|
|
 |
 |
 |
| £0-5K |
8.23% |
9.41% |
87.43 |
|
| £5-10K |
15.61% |
16.63% |
93.85 |
|
| £10-15K |
16.39% |
16.58% |
98.87 |
|
| £15-20K |
13.93% |
13.58% |
102.55 |
|
| £20-25K |
10.93% |
10.39% |
105.12 |
|
| £25-30K |
8.30% |
7.77% |
106.80 |
|
| £30-35K |
6.24% |
5.79% |
107.73 |
|
| £35-40K |
4.68% |
4.33% |
108.05 |
|
| £40-45K |
3.52% |
3.27% |
107.84 |
|
| £45-50K |
2.66% |
2.48% |
107.22 |
|
| £50-55K |
2.02% |
1.90% |
106.27 |
|
| £55-60K |
1.55% |
1.47% |
105.05 |
|
| £60-65K |
1.19% |
1.15% |
103.62 |
|
| £65-70K |
0.93% |
0.91% |
102.05 |
|
| £70-75K |
0.72% |
0.72% |
100.36 |
|
| £75-80K |
0.57% |
0.57% |
98.59 |
|
| £80-85K |
0.45% |
0.46% |
96.78 |
|
| £85-90K |
0.36% |
0.37% |
94.94 |
|
| £90-95K |
0.28% |
0.31% |
93.08 |
|
| £95-100K |
0.23% |
0.25% |
91.23 |
|
| £100K + |
1.07% |
1.34% |
79.42 |
|
|
|

|


|
1992-1997
|
1997-2001
|
|
|
|
| Con |
-12.18% |
| Lab |
10.21% |
| LD |
-0.26% |
|
| Con |
-0.88% |
| Lab |
-0.58% |
| LD |
3.88% |
|
|
 |
David Chaytor
Labour hold
|
| Con |
 |
16,413 |
36.65% |
| Lab |
 |
22,945 |
51.23% |
| LD |
 |
5,430 |
12.12% |
| Oth |
|
0 |
0.00% |
| Maj |
 |
6,532 |
14.58% |
| Turn |
 |
44,788 |
62.99% |
|
|
 |
David Chaytor
Labour hold
|
| L |
David Chaytor |
22,945 |
51.23% |
| LD |
Bryn Hackley |
5,430 |
12.12% |
| C |
John Walsh |
16,413 |
36.65% |
|
Candidates representing 3 parties stood for election to this seat.
|
|
 |
David Chaytor
Labour gain
|
| Con |
 |
20,657 |
37.52% |
| Lab |
 |
28,523 |
51.81% |
| LD |
 |
4,536 |
8.24% |
| Ref |
 |
1,337 |
2.43% |
| Oth |
|
0 |
0.00% |
| Maj |
 |
7,866 |
14.29% |
| Turn |
 |
55,053 |
78.07% |
|
|
 |
|
Conservative
|
| Con |
 |
29,266 |
49.70% |
| Lab |
 |
24,502 |
41.60% |
| LD |
 |
5,010 |
8.50% |
| Oth |
 |
163 |
0.30% |
| Maj |
 |
4,764 |
8.10% |
| Turn |
 |
58,941 |
83.91% |
|
|
 |
|

|

