|
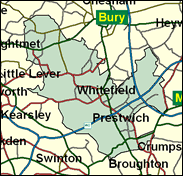
Bury South
Labour hold

Bury South was named in early September 2000 by the Telegraph as the seat which, if it were to fall, would give William Hague an overall majority at the next General Election. It would take a swing of over 12 per cent. The Conservatives were not in the lead even in the Euro elections of June 1999, on a 20 pc turnout on just about their strongest issue. In the May 2000 local elections, Labour held the Bury Borough wards covering Besses o' the Barn, Radcliffe Central, North and South, and Sedgley and St Mary's in Prestwich, leaving only Pilkington Park (by 6 votes) to the Tories, and Holyrood to the Liberal Democrats. One should never discount possibilities, but it doesn't seem likely to happen for Mr Hague and his party on this evidence.

Ivan Lewis, a leading Zionist and PPS to Stephen Byers, balances his less on-message neighbour in Bury North, David Chaytor, as an ultra loyalist Blairite, displaying according to one observer, "glutinous fealty" with his "robotic" interjections. Prestwich-born (1967) and educated at William Hulme's Grammar School (until his parents ran out of cash), Strand Sixth Form College and Bury FE College, he worked for a Jewish welfare organisation in Manchester. His wife works for the Leeds-based Kosher food firm, Rakusens. With the retirement of Greville Janner he is perhaps the highest profile Zionist MP.

 |
| Wealthy Achievers, Suburban Areas |
15.37% |
14.99% |
102.54 |
|
| Affluent Greys, Rural Communities |
0.00% |
2.13% |
0.00 |
|
| Prosperous Pensioners, Retirement Areas |
1.76% |
2.49% |
70.75 |
|
| Affluent Executives, Family Areas |
3.38% |
4.43% |
76.35 |
|
| Well-Off Workers, Family Areas |
12.32% |
7.27% |
169.37 |
|
| Affluent Urbanites, Town & City Areas |
0.48% |
2.56% |
18.56 |
|
| Prosperous Professionals, Metropolitan Areas |
0.36% |
2.04% |
17.53 |
|
| Better-Off Executives, Inner City Areas |
1.92% |
3.94% |
48.64 |
|
| Comfortable Middle Agers, Mature Home Owning Areas |
19.40% |
13.04% |
148.79 |
|
| Skilled Workers, Home Owning Areas |
19.33% |
12.70% |
152.14 |
|
| New Home Owners, Mature Communities |
6.01% |
8.14% |
73.79 |
|
| White Collar Workers, Better-Off Multi Ethnic Areas |
1.42% |
4.02% |
35.23 |
|
| Older People, Less Prosperous Areas |
5.18% |
3.19% |
162.68 |
|
| Council Estate Residents, Better-Off Homes |
10.33% |
11.31% |
91.37 |
|
| Council Estate Residents, High Unemployment |
1.03% |
3.06% |
33.74 |
|
| Council Estate Residents, Greatest Hardship |
1.70% |
2.52% |
67.49 |
|
| People in Multi-Ethnic, Low-Income Areas |
0.00% |
2.10% |
0.00 |
|
| Unclassified |
0.02% |
0.06% |
25.03 |
|
|
 |
 |
 |
| £0-5K |
8.83% |
9.41% |
93.82 |
|
| £5-10K |
15.92% |
16.63% |
95.71 |
|
| £10-15K |
16.37% |
16.58% |
98.75 |
|
| £15-20K |
13.76% |
13.58% |
101.33 |
|
| £20-25K |
10.73% |
10.39% |
103.21 |
|
| £25-30K |
8.12% |
7.77% |
104.40 |
|
| £30-35K |
6.08% |
5.79% |
105.01 |
|
| £35-40K |
4.56% |
4.33% |
105.15 |
|
| £40-45K |
3.43% |
3.27% |
104.91 |
|
| £45-50K |
2.59% |
2.48% |
104.39 |
|
| £50-55K |
1.97% |
1.90% |
103.66 |
|
| £55-60K |
1.52% |
1.47% |
102.76 |
|
| £60-65K |
1.17% |
1.15% |
101.75 |
|
| £65-70K |
0.91% |
0.91% |
100.66 |
|
| £70-75K |
0.72% |
0.72% |
99.51 |
|
| £75-80K |
0.57% |
0.57% |
98.32 |
|
| £80-85K |
0.45% |
0.46% |
97.12 |
|
| £85-90K |
0.36% |
0.37% |
95.90 |
|
| £90-95K |
0.29% |
0.31% |
94.69 |
|
| £95-100K |
0.23% |
0.25% |
93.49 |
|
| £100K + |
1.15% |
1.34% |
85.72 |
|
|
|

|


|
1992-1997
|
1997-2001
|
|
|
|
| Con |
-13.76% |
| Lab |
12.34% |
| LD |
-0.60% |
|
| Con |
-5.34% |
| Lab |
2.25% |
| LD |
5.51% |
|
|
 |
Ivan Lewis
Labour hold
|
| Con |
 |
10,634 |
26.89% |
| Lab |
 |
23,406 |
59.20% |
| LD |
 |
5,499 |
13.91% |
| Oth |
|
0 |
0.00% |
| Maj |
 |
12,772 |
32.30% |
| Turn |
 |
39,539 |
58.77% |
|
|
 |
Ivan Lewis
Labour hold
|
| C |
Nicola Le Page |
10,634 |
26.89% |
| L |
Ivan Lewis |
23,406 |
59.20% |
| LD |
Tim Pickstone |
5,499 |
13.91% |
|
Candidates representing 3 parties stood for election to this seat.
|
|
 |
Ivan Lewis
Labour gain
|
| Con |
 |
16,225 |
32.24% |
| Lab |
 |
28,658 |
56.94% |
| LD |
 |
4,227 |
8.40% |
| Ref |
 |
1,216 |
2.42% |
| Oth |
|
0 |
0.00% |
| Maj |
 |
12,433 |
24.70% |
| Turn |
 |
50,326 |
75.60% |
|
|
 |
|
Conservative
|
| Con |
 |
24,925 |
46.00% |
| Lab |
 |
24,197 |
44.60% |
| LD |
 |
4,853 |
9.00% |
| Oth |
 |
229 |
0.40% |
| Maj |
 |
728 |
1.30% |
| Turn |
 |
54,204 |
81.64% |
|
|
 |
|

|

