|
Amber Valley
Labour hold

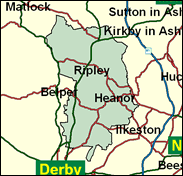
In spite of its attractive name, this is a decidedly industrial ex-coal mining part of the less beautiful section of Derbyshire (south rather than north, and east rather than west). Gritty little towns like Alfreton and Heanor and Ripley are not known for their Conservative traditions, and it was only at the Tory-highpoint of Thatcherism that Phillip Oppenheim could secure his three successive victories (1983-92). He was thrashed in 1997 by Judy Mallaber, and his political activities diverted into a thoughtful and independently minded newspaper column. The Conservatives apparently did outstandingly well in the May 2000 Amber Valley council elections, but beware: most of their success came in wards placed outside this seat, such as those in Belper (West Derbyshire constituency).

Judy Mallaber, elected in 1997, belies a sectarian past including Communist Party membership and chairmanship of the Left-wing independent Labour Research Department, as a witty, fluent Blairite loyalist. With the impeccably elitist academic pedigree of North London Collegiate and St Anne’s College, Oxford, she worked for ten years as research officer for NUPE, whose commitment to a national minimum wage she has duly reflected in Commons interventions. Frizzy-haired and wire-rimmed spectacled in Guardianesque mode, her lack of ministerial advancement may well be linked to her advancing years, as she hits 50 this year.

 |
| Wealthy Achievers, Suburban Areas |
11.10% |
14.99% |
74.04 |
|
| Affluent Greys, Rural Communities |
0.11% |
2.13% |
5.30 |
|
| Prosperous Pensioners, Retirement Areas |
0.10% |
2.49% |
4.06 |
|
| Affluent Executives, Family Areas |
1.47% |
4.43% |
33.32 |
|
| Well-Off Workers, Family Areas |
9.04% |
7.27% |
124.34 |
|
| Affluent Urbanites, Town & City Areas |
0.03% |
2.56% |
1.12 |
|
| Prosperous Professionals, Metropolitan Areas |
0.00% |
2.04% |
0.00 |
|
| Better-Off Executives, Inner City Areas |
0.00% |
3.94% |
0.00 |
|
| Comfortable Middle Agers, Mature Home Owning Areas |
13.74% |
13.04% |
105.35 |
|
| Skilled Workers, Home Owning Areas |
39.96% |
12.70% |
314.58 |
|
| New Home Owners, Mature Communities |
14.97% |
8.14% |
183.83 |
|
| White Collar Workers, Better-Off Multi Ethnic Areas |
0.00% |
4.02% |
0.00 |
|
| Older People, Less Prosperous Areas |
3.69% |
3.19% |
115.75 |
|
| Council Estate Residents, Better-Off Homes |
5.30% |
11.31% |
46.84 |
|
| Council Estate Residents, High Unemployment |
0.09% |
3.06% |
3.05 |
|
| Council Estate Residents, Greatest Hardship |
0.39% |
2.52% |
15.56 |
|
| People in Multi-Ethnic, Low-Income Areas |
0.00% |
2.10% |
0.00 |
|
| Unclassified |
0.00% |
0.06% |
0.00 |
|
|
 |
 |
 |
| £0-5K |
9.80% |
9.41% |
104.08 |
|
| £5-10K |
18.53% |
16.63% |
111.38 |
|
| £10-15K |
18.65% |
16.58% |
112.47 |
|
| £15-20K |
14.87% |
13.58% |
109.48 |
|
| £20-25K |
10.85% |
10.39% |
104.38 |
|
| £25-30K |
7.66% |
7.77% |
98.50 |
|
| £30-35K |
5.36% |
5.79% |
92.56 |
|
| £35-40K |
3.77% |
4.33% |
86.94 |
|
| £40-45K |
2.67% |
3.27% |
81.77 |
|
| £45-50K |
1.91% |
2.48% |
77.10 |
|
| £50-55K |
1.39% |
1.90% |
72.93 |
|
| £55-60K |
1.02% |
1.47% |
69.20 |
|
| £60-65K |
0.76% |
1.15% |
65.89 |
|
| £65-70K |
0.57% |
0.91% |
62.93 |
|
| £70-75K |
0.43% |
0.72% |
60.29 |
|
| £75-80K |
0.33% |
0.57% |
57.92 |
|
| £80-85K |
0.26% |
0.46% |
55.79 |
|
| £85-90K |
0.20% |
0.37% |
53.86 |
|
| £90-95K |
0.16% |
0.31% |
52.12 |
|
| £95-100K |
0.13% |
0.25% |
50.54 |
|
| £100K + |
0.58% |
1.34% |
43.52 |
|
|
|

|


|
1992-1997
|
1997-2001
|
|
|
|
| Con |
-13.04% |
| Lab |
10.27% |
| LD |
-1.40% |
|
| Con |
2.20% |
| Lab |
-2.77% |
| LD |
4.74% |
|
|
 |
Judy Mallaber
Labour hold
|
| Con |
 |
15,874 |
35.66% |
| Lab |
 |
23,101 |
51.90% |
| LD |
 |
5,538 |
12.44% |
| Oth |
|
0 |
0.00% |
| Maj |
 |
7,227 |
16.24% |
| Turn |
 |
44,513 |
100.00% |
|
|
 |
Judy Mallaber
Labour hold
|
| L |
Judy Mallaber |
23,101 |
51.90% |
| C |
Gillian Shaw |
15,874 |
35.66% |
| LD |
Kate Smith |
5,538 |
12.44% |
|
Candidates representing 3 parties stood for election to this seat.
|
|
 |
Judy Mallaber
Labour gain
|
| Con |
 |
18,330 |
33.46% |
| Lab |
 |
29,943 |
54.67% |
| LD |
 |
4,219 |
7.70% |
| Ref |
 |
2,283 |
4.17% |
| Oth |
|
0 |
0.00% |
| Maj |
 |
11,613 |
21.20% |
| Turn |
 |
54,775 |
76.07% |
|
|
 |
|
Conservative
|
| Con |
 |
28,360 |
46.50% |
| Lab |
 |
27,077 |
44.40% |
| LD |
 |
5,582 |
9.10% |
| Oth |
|
0 |
0.00% |
| Maj |
 |
1,283 |
2.10% |
| Turn |
 |
61,019 |
83.67% |
|
|
 |
|

|

