|
Bury St Edmunds
Conservative hold

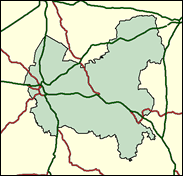
Although David Ruffley held on by just 368 votes over Labour in 1997, a Labour gain in rural Suffolk is not expected at the next General Election. Their support is confined to parts of Bury St Edmunds, especially those mainly in the north of the town which have received overspill population from London, and in the Mid Suffolk town of Stowmarket. The Conservatives pull back in the villages, and having led by 17 per cent in the Euro-elections of 1999 and regained St Edmundsbury council in the same year they have no recent record of failure at any level within this seat.

David Ruffley, dubbed by ex-MP Michael Brown "a new Tory rottweiler, shaping up to be the rudest MP", with an instinct for the jugular, narrowly won here in 1997. Politically ecumenical as Ken Clarke's former rightwing conscience, he served Clarke as special adviser at Education, Home Office and Treasury over five years up to 1996. Born 1962, educated at Bolton School and Queen's College Cambridge, he was originally with the City law form of Clifford Chance. He has enjoyed baiting Chancellor Brown on tax levels and Geoffrey Robinson, and the self-styled Cardinal Wolsey, Lord Chancellor Irvine on wallpaper. A single currency opponent he strongly defends first-past-the-post voting and is pencilled-in for eventual high office as long as he fights off the challenge of Labour's Mark Ereira who fought the seat in 1997. A regional manager with Lloyds TSB Foundation, he was previously a charity worker with Suffolk Acre. He was born in 1961 and was educated at Cambridgeshire College of Arts and Technology, King's College Cambridge and Kent University.

 |
| Wealthy Achievers, Suburban Areas |
20.07% |
14.99% |
133.87 |
|
| Affluent Greys, Rural Communities |
4.30% |
2.13% |
202.29 |
|
| Prosperous Pensioners, Retirement Areas |
3.99% |
2.49% |
160.62 |
|
| Affluent Executives, Family Areas |
10.38% |
4.43% |
234.52 |
|
| Well-Off Workers, Family Areas |
12.14% |
7.27% |
166.85 |
|
| Affluent Urbanites, Town & City Areas |
0.20% |
2.56% |
7.69 |
|
| Prosperous Professionals, Metropolitan Areas |
0.04% |
2.04% |
1.92 |
|
| Better-Off Executives, Inner City Areas |
0.14% |
3.94% |
3.45 |
|
| Comfortable Middle Agers, Mature Home Owning Areas |
20.64% |
13.04% |
158.26 |
|
| Skilled Workers, Home Owning Areas |
8.23% |
12.70% |
64.78 |
|
| New Home Owners, Mature Communities |
5.64% |
8.14% |
69.31 |
|
| White Collar Workers, Better-Off Multi Ethnic Areas |
3.99% |
4.02% |
99.17 |
|
| Older People, Less Prosperous Areas |
2.30% |
3.19% |
72.25 |
|
| Council Estate Residents, Better-Off Homes |
7.83% |
11.31% |
69.22 |
|
| Council Estate Residents, High Unemployment |
0.03% |
3.06% |
0.99 |
|
| Council Estate Residents, Greatest Hardship |
0.09% |
2.52% |
3.52 |
|
| People in Multi-Ethnic, Low-Income Areas |
0.00% |
2.10% |
0.00 |
|
| Unclassified |
0.00% |
0.06% |
0.00 |
|
|
 |
 |
 |
| £0-5K |
7.89% |
9.41% |
83.85 |
|
| £5-10K |
15.74% |
16.63% |
94.61 |
|
| £10-15K |
16.97% |
16.58% |
102.35 |
|
| £15-20K |
14.50% |
13.58% |
106.72 |
|
| £20-25K |
11.27% |
10.39% |
108.47 |
|
| £25-30K |
8.43% |
7.77% |
108.44 |
|
| £30-35K |
6.21% |
5.79% |
107.25 |
|
| £35-40K |
4.56% |
4.33% |
105.36 |
|
| £40-45K |
3.37% |
3.27% |
103.07 |
|
| £45-50K |
2.50% |
2.48% |
100.58 |
|
| £50-55K |
1.87% |
1.90% |
98.02 |
|
| £55-60K |
1.41% |
1.47% |
95.47 |
|
| £60-65K |
1.07% |
1.15% |
92.98 |
|
| £65-70K |
0.82% |
0.91% |
90.59 |
|
| £70-75K |
0.64% |
0.72% |
88.31 |
|
| £75-80K |
0.50% |
0.57% |
86.14 |
|
| £80-85K |
0.39% |
0.46% |
84.09 |
|
| £85-90K |
0.31% |
0.37% |
82.15 |
|
| £90-95K |
0.25% |
0.31% |
80.33 |
|
| £95-100K |
0.20% |
0.25% |
78.61 |
|
| £100K + |
0.94% |
1.34% |
69.75 |
|
|
|

|


|
1992-1997
|
1997-2001
|
|
|
|
| Con |
-7.56% |
| Lab |
11.68% |
| LD |
-8.71% |
|
| Con |
5.13% |
| Lab |
0.82% |
| LD |
-4.27% |
|
|
 |
David Ruffley
Conservative hold
|
| Con |
 |
21,850 |
43.48% |
| Lab |
 |
19,347 |
38.50% |
| LD |
 |
6,998 |
13.92% |
| Oth |
 |
2,062 |
4.10% |
| Maj |
 |
2,503 |
4.98% |
| Turn |
 |
50,257 |
66.00% |
|
|
 |
David Ruffley
Conservative hold
|
| SL |
Michael Benwell |
580 |
1.15% |
| I |
Mike Brundle |
651 |
1.30% |
| L |
Mark Ereira |
19,347 |
38.50% |
| UK |
John Howlett |
831 |
1.65% |
| C |
David Ruffley |
21,850 |
43.48% |
| LD |
Richard Williams |
6,998 |
13.92% |
|
Candidates representing 6 parties stood for election to this seat.
|
|
 |
David Ruffley
Conservative
|
| Con |
 |
21,290 |
38.34% |
| Lab |
 |
20,922 |
37.68% |
| LD |
 |
10,102 |
18.19% |
| Ref |
 |
2,939 |
5.29% |
| Oth |
 |
272 |
0.49% |
| Maj |
 |
368 |
0.66% |
| Turn |
 |
55,525 |
75.02% |
|
|
 |
|
Conservative
|
| Con |
 |
25,742 |
45.90% |
| Lab |
 |
14,565 |
26.00% |
| LD |
 |
15,097 |
26.90% |
| Oth |
 |
666 |
1.20% |
| Maj |
 |
10,645 |
19.00% |
| Turn |
 |
56,070 |
79.89% |
|
|
 |
|

|

