|
Caernarfon
Plaid Cymru hold

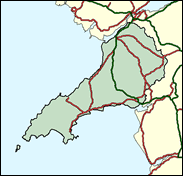
The Caernarfon constituency is in many ways the very heart of Welshness. It was for good reason that in 1969 the mighty Norman castle of Caernarfon saw the investiture of a Prince of Wales who seemed very English to most observers. This is the home of nonconformist religion and radical politics, for half a century the constituency of David Lloyd George. The Conservatives have always been too English a party to do well here, but Labour held the seat from 1945 until in 1974 it became one of the first constituencies ever to fall to Plaid Cymru, the Welsh Nationalists, in the shape of a young man called Dafydd Wigley. Wigley has effectively disengaged from Westminster politics, ceding the leadership of Plaid Cymru to the Ynys Mon (Anglesey) MP Ieuan Wyn Jones and announcing his retirement after 26 years as member for Caernarfon. This is the most heavily Welsh speaking of all constituencies (79pc can speak the language), including the most Welsh-speaking town, Caernarfon itself (88pc) and ward, Peblig (92pc). It will remain very safe for the Nationalists' new representative in London.

Hywel Williams, a locally-born (1953) shopkeeper's son, educated at Ysgol Glan y Mor, Pwllheli, and Cardiff and Bangor Universities, is a former social worker in Glamorgan and then Gwynedd, who became a social work lecturer at Bangor University in 1984 and headed its Social Work Practice Centre for two years before 1994, before becoming a freelance lecturer and consultant. With his Party penetrating Anglicised South Wales seats with non-Welsh-speaking candidates, he sounds a more exclusive note by listing 'language policy' among his interests.

 |
| Wealthy Achievers, Suburban Areas |
4.75% |
14.99% |
31.66 |
|
| Affluent Greys, Rural Communities |
30.97% |
2.13% |
1,456.67 |
|
| Prosperous Pensioners, Retirement Areas |
2.41% |
2.49% |
97.04 |
|
| Affluent Executives, Family Areas |
0.39% |
4.43% |
8.89 |
|
| Well-Off Workers, Family Areas |
2.84% |
7.27% |
39.01 |
|
| Affluent Urbanites, Town & City Areas |
0.40% |
2.56% |
15.47 |
|
| Prosperous Professionals, Metropolitan Areas |
0.00% |
2.04% |
0.00 |
|
| Better-Off Executives, Inner City Areas |
0.79% |
3.94% |
19.96 |
|
| Comfortable Middle Agers, Mature Home Owning Areas |
18.66% |
13.04% |
143.07 |
|
| Skilled Workers, Home Owning Areas |
7.66% |
12.70% |
60.30 |
|
| New Home Owners, Mature Communities |
8.33% |
8.14% |
102.30 |
|
| White Collar Workers, Better-Off Multi Ethnic Areas |
11.95% |
4.02% |
297.23 |
|
| Older People, Less Prosperous Areas |
2.12% |
3.19% |
66.67 |
|
| Council Estate Residents, Better-Off Homes |
6.00% |
11.31% |
53.07 |
|
| Council Estate Residents, High Unemployment |
0.00% |
3.06% |
0.00 |
|
| Council Estate Residents, Greatest Hardship |
2.73% |
2.52% |
108.26 |
|
| People in Multi-Ethnic, Low-Income Areas |
0.00% |
2.10% |
0.00 |
|
| Unclassified |
0.00% |
0.06% |
0.00 |
|
|
 |
 |
 |
| £0-5K |
13.14% |
9.41% |
139.63 |
|
| £5-10K |
21.07% |
16.63% |
126.70 |
|
| £10-15K |
19.07% |
16.58% |
115.02 |
|
| £15-20K |
14.18% |
13.58% |
104.40 |
|
| £20-25K |
9.87% |
10.39% |
94.95 |
|
| £25-30K |
6.73% |
7.77% |
86.62 |
|
| £30-35K |
4.59% |
5.79% |
79.33 |
|
| £35-40K |
3.16% |
4.33% |
72.94 |
|
| £40-45K |
2.20% |
3.27% |
67.34 |
|
| £45-50K |
1.55% |
2.48% |
62.42 |
|
| £50-55K |
1.11% |
1.90% |
58.08 |
|
| £55-60K |
0.80% |
1.47% |
54.25 |
|
| £60-65K |
0.59% |
1.15% |
50.85 |
|
| £65-70K |
0.43% |
0.91% |
47.81 |
|
| £70-75K |
0.32% |
0.72% |
45.10 |
|
| £75-80K |
0.25% |
0.57% |
42.66 |
|
| £80-85K |
0.19% |
0.46% |
40.46 |
|
| £85-90K |
0.14% |
0.37% |
38.47 |
|
| £90-95K |
0.11% |
0.31% |
36.67 |
|
| £95-100K |
0.09% |
0.25% |
35.02 |
|
| £100K + |
0.37% |
1.34% |
27.62 |
|
|
|

|


|
1992-1997
|
1997-2001
|
|
|
|
| Con |
-6.76% |
| Lab |
12.92% |
| LD |
-0.84% |
| PC |
-7.20% |
|
| Con |
2.72% |
| Lab |
3.87% |
| LD |
1.32% |
|
|
 |
Hywel Williams
Plaid Cymru hold
|
| Con |
 |
4,403 |
15.16% |
| Lab |
 |
9,383 |
32.30% |
| LD |
 |
1,823 |
6.27% |
| PC |
 |
12,894 |
44.38% |
| Oth |
 |
550 |
1.89% |
| Maj |
 |
3,511 |
12.08% |
| Turn |
 |
29,053 |
61.35% |
|
|
 |
Hywel Williams
Plaid Cymru hold
|
| L |
Martin Eaglestone |
9,383 |
32.30% |
| UK |
Ifor Llody |
550 |
1.89% |
| C |
Bronwen Nash |
4,403 |
15.16% |
| LD |
Melab Owain |
1,823 |
6.27% |
| PC |
Hywel Williams |
12,894 |
44.38% |
|
Candidates representing 5 parties stood for election to this seat.
|
|
 |
Dafydd Wigley
Plaid Cymru
|
| Con |
 |
4,230 |
12.44% |
| Lab |
 |
9,667 |
28.42% |
| LD |
 |
1,686 |
4.96% |
| PC |
 |
17,616 |
51.80% |
| Ref |
 |
811 |
2.38% |
| Oth |
|
0 |
0.00% |
| Maj |
 |
7,949 |
23.37% |
| Turn |
 |
34,010 |
72.65% |
|
|
 |
|
Plaid Cymru
|
| Con |
 |
6,963 |
19.20% |
| Lab |
 |
5,641 |
15.50% |
| LD |
 |
2,101 |
5.80% |
| PC |
 |
21,439 |
59.00% |
| Oth |
 |
173 |
0.50% |
| Maj |
 |
14,476 |
39.90% |
| Turn |
 |
36,317 |
77.11% |
|
|
 |
|

|

