|
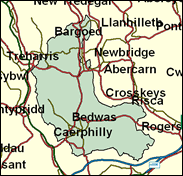
Caerphilly
Labour hold

Caerphilly, though only just over a hill (or Welsh "mountain") from Cardiff, is very definitely in the South Welsh valley tradition of politics. Its MP since 1983 has been Mr Blair's first Secretary of State for Wales, Ron Davies, who was also the first choice for First Secretary of his native land until overtaken by scandal in October 1998. Davies safely transferred to the Welsh Assembly in May 1999, although his majority over Plaid Cymru of 2,861 was little over one tenth of that he recorded in the 1997 General Election. His adventures on Clapham Common may have ended his Cabinet career, but not all political activity. Nevertheless, due to rules concerning dual mandates he is vacating Caerphilly's parliamentary seat, in favour of Wayne David, former Labour MEP, defeated candidate in the Rhondda (of all places) in the Welsh Assembly elections of 1999, but very likely the first "Wayne" ever to enter the House of Commons.

Beleaguered former Welsh Secretary Ron Davies' successor here is Wayne David, a former MEP. His profile is very familiar as the grandson (not even son) of miners, the son of a teacher, and himself an ex-WEA tutor organiser - in the steps of Neil Kinnock and Ron Davies. Born 1957 and educated at Cynffig Comprehensive, Kenfig Hill Bridgend, and at Swansea and Cardiff Universities, he is currently a policy adviser for the Youth Service. He lists devolution as one of his interests and already bears its scars, having been beaten by Plaid Cymru in the Welsh assembly election in 1999 in the Rhondda, the first ever loss by Labour of the area since capturing it in 1910.

 |
| Wealthy Achievers, Suburban Areas |
4.48% |
14.99% |
29.90 |
|
| Affluent Greys, Rural Communities |
0.00% |
2.13% |
0.00 |
|
| Prosperous Pensioners, Retirement Areas |
0.29% |
2.49% |
11.47 |
|
| Affluent Executives, Family Areas |
1.54% |
4.43% |
34.72 |
|
| Well-Off Workers, Family Areas |
15.24% |
7.27% |
209.55 |
|
| Affluent Urbanites, Town & City Areas |
0.00% |
2.56% |
0.00 |
|
| Prosperous Professionals, Metropolitan Areas |
0.00% |
2.04% |
0.00 |
|
| Better-Off Executives, Inner City Areas |
0.00% |
3.94% |
0.00 |
|
| Comfortable Middle Agers, Mature Home Owning Areas |
6.59% |
13.04% |
50.56 |
|
| Skilled Workers, Home Owning Areas |
30.11% |
12.70% |
237.04 |
|
| New Home Owners, Mature Communities |
14.97% |
8.14% |
183.81 |
|
| White Collar Workers, Better-Off Multi Ethnic Areas |
0.63% |
4.02% |
15.74 |
|
| Older People, Less Prosperous Areas |
3.14% |
3.19% |
98.44 |
|
| Council Estate Residents, Better-Off Homes |
18.63% |
11.31% |
164.69 |
|
| Council Estate Residents, High Unemployment |
0.30% |
3.06% |
9.72 |
|
| Council Estate Residents, Greatest Hardship |
4.06% |
2.52% |
161.19 |
|
| People in Multi-Ethnic, Low-Income Areas |
0.00% |
2.10% |
0.00 |
|
| Unclassified |
0.03% |
0.06% |
45.91 |
|
|
 |
|
|
| £0-5K |
11.20% |
9.41% |
118.93 |
|
| £5-10K |
19.67% |
16.63% |
118.29 |
|
| £10-15K |
18.85% |
16.58% |
113.71 |
|
| £15-20K |
14.62% |
13.58% |
107.60 |
|
| £20-25K |
10.47% |
10.39% |
100.77 |
|
| £25-30K |
7.29% |
7.77% |
93.78 |
|
| £30-35K |
5.04% |
5.79% |
86.98 |
|
| £35-40K |
3.49% |
4.33% |
80.55 |
|
| £40-45K |
2.44% |
3.27% |
74.60 |
|
| £45-50K |
1.72% |
2.48% |
69.16 |
|
| £50-55K |
1.22% |
1.90% |
64.22 |
|
| £55-60K |
0.88% |
1.47% |
59.76 |
|
| £60-65K |
0.64% |
1.15% |
55.73 |
|
| £65-70K |
0.47% |
0.91% |
52.09 |
|
| £70-75K |
0.35% |
0.72% |
48.81 |
|
| £75-80K |
0.26% |
0.57% |
45.85 |
|
| £80-85K |
0.20% |
0.46% |
43.17 |
|
| £85-90K |
0.15% |
0.37% |
40.73 |
|
| £90-95K |
0.12% |
0.31% |
38.52 |
|
| £95-100K |
0.09% |
0.25% |
36.51 |
|
| £100K + |
0.37% |
1.34% |
27.55 |
|
|
|
|


|
1992-1997
|
1997-2001
|
|
|
|
| Con |
-7.37% |
| Lab |
4.11% |
| LD |
-0.27% |
| PC |
-0.02% |
|
| Con |
0.63% |
| Lab |
-9.62% |
| LD |
1.17% |
| PC |
11.36% |
|
|
|
Wayne David
Labour hold
|
| Con |
 |
4,413 |
11.36% |
| Lab |
 |
22,597 |
58.19% |
| LD |
 |
3,649 |
9.40% |
| PC |
 |
8,172 |
21.05% |
| Oth |
|
0 |
0.00% |
| Maj |
 |
14,425 |
37.15% |
| Turn |
|
38,831 |
57.45% |
|
|
|
Wayne David
Labour hold
|
| L |
Wayne David |
22,597 |
58.19% |
| LD |
Rob Roffe |
3,649 |
9.40% |
| C |
David Simmonds |
4,413 |
11.36% |
| PC |
Lindsay Whittle |
8,172 |
21.05% |
|
Candidates representing 4 parties stood for election to this seat.
|
|
|
Ron Davies
Labour
|
| Con |
|
4,858 |
10.73% |
| Lab |
|
30,697 |
67.81% |
| LD |
|
3,724 |
8.23% |
| PC |
|
4,383 |
9.68% |
| Ref |
 |
1,337 |
2.95% |
| Oth |
 |
270 |
0.60% |
| Maj |
|
25,839 |
57.08% |
| Turn |
|
45,269 |
70.05% |
|
|
|
|
Labour
|
| Con |
|
9,041 |
18.10% |
| Lab |
|
31,713 |
63.70% |
| LD |
|
4,247 |
8.50% |
| PC |
|
4,821 |
9.70% |
| Oth |
|
0 |
0.00% |
| Maj |
|
22,672 |
45.50% |
| Turn |
|
49,822 |
76.66% |
|
|
|
|
|