|
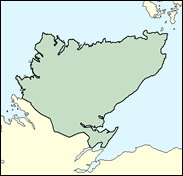
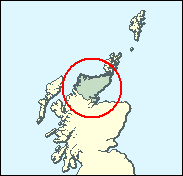
Caithness, Sutherland and Easter Ross
Liberal Democrat hold

The longest-serving Liberal Democrat MP (though his 34 years in the Commons include spells under the banners of Labour and the SDP as well as the Lib Dems), Robert Maclennan, has finally announced his retirement. In the individual politics of the most northern constituency on the British mainland, nothing can ever be taken for granted, but given that a non-Maclennan held this seat in the 1999 Scottish parliament elections, and that by a 17pc margin over a close thing for second place between Labour and the SNP, the favourite should be his nominated Liberal Democrat successor, Viscount (John) Thurso, who, as his name implies, has impeccable local credentials.

With the retirement of veteran MP Robert MacLennan, the Liberal Democrats have reached into their topmost drawer and unearthed old Etonian local landowner, John Thurso as their new candidate. Actually, 'Sir John Archibald Sinclair, 3rd Viscount Thurso, and 6th Baronet of Ulbster,' he is the grandson of former Liberal Party leader Sir Archibald Sinclair, Air Minister in Churchill's wartime coalition and MP here 1922-45. A beneficiary of reform enabling discarded hereditary peers to stand for the Commons, and sporter of a Kitchener-style military moustache redolent of a Victorian melodrama, he comes with multiple directorships (in banking, fishing, catering and fitness), a castle, and membership of Brooks, and will, on reaching the House, double the number of Lib Dem Old Etonians from one to two.

 |
| Wealthy Achievers, Suburban Areas |
4.82% |
14.99% |
32.15 |
|
| Affluent Greys, Rural Communities |
20.34% |
2.13% |
956.53 |
|
| Prosperous Pensioners, Retirement Areas |
0.43% |
2.49% |
17.15 |
|
| Affluent Executives, Family Areas |
3.74% |
4.43% |
84.46 |
|
| Well-Off Workers, Family Areas |
2.31% |
7.27% |
31.70 |
|
| Affluent Urbanites, Town & City Areas |
0.07% |
2.56% |
2.86 |
|
| Prosperous Professionals, Metropolitan Areas |
0.00% |
2.04% |
0.00 |
|
| Better-Off Executives, Inner City Areas |
0.08% |
3.94% |
2.10 |
|
| Comfortable Middle Agers, Mature Home Owning Areas |
16.25% |
13.04% |
124.65 |
|
| Skilled Workers, Home Owning Areas |
4.29% |
12.70% |
33.75 |
|
| New Home Owners, Mature Communities |
12.52% |
8.14% |
153.73 |
|
| White Collar Workers, Better-Off Multi Ethnic Areas |
1.93% |
4.02% |
48.07 |
|
| Older People, Less Prosperous Areas |
3.85% |
3.19% |
120.72 |
|
| Council Estate Residents, Better-Off Homes |
18.25% |
11.31% |
161.39 |
|
| Council Estate Residents, High Unemployment |
1.61% |
3.06% |
52.68 |
|
| Council Estate Residents, Greatest Hardship |
9.51% |
2.52% |
377.61 |
|
| People in Multi-Ethnic, Low-Income Areas |
0.00% |
2.10% |
0.00 |
|
| Unclassified |
0.00% |
0.06% |
0.00 |
|
|
 |
 |
 |
| £0-5K |
9.90% |
9.41% |
105.12 |
|
| £5-10K |
19.67% |
16.63% |
118.24 |
|
| £10-15K |
19.49% |
16.58% |
117.56 |
|
| £15-20K |
15.15% |
13.58% |
111.55 |
|
| £20-25K |
10.78% |
10.39% |
103.68 |
|
| £25-30K |
7.43% |
7.77% |
95.54 |
|
| £30-35K |
5.08% |
5.79% |
87.79 |
|
| £35-40K |
3.50% |
4.33% |
80.68 |
|
| £40-45K |
2.43% |
3.27% |
74.27 |
|
| £45-50K |
1.70% |
2.48% |
68.55 |
|
| £50-55K |
1.21% |
1.90% |
63.46 |
|
| £55-60K |
0.87% |
1.47% |
58.92 |
|
| £60-65K |
0.63% |
1.15% |
54.86 |
|
| £65-70K |
0.46% |
0.91% |
51.23 |
|
| £70-75K |
0.34% |
0.72% |
47.97 |
|
| £75-80K |
0.26% |
0.57% |
45.02 |
|
| £80-85K |
0.20% |
0.46% |
42.35 |
|
| £85-90K |
0.15% |
0.37% |
39.93 |
|
| £90-95K |
0.12% |
0.31% |
37.72 |
|
| £95-100K |
0.09% |
0.25% |
35.70 |
|
| £100K + |
0.36% |
1.34% |
26.50 |
|
|
|

|


|
1992-1997
|
1997-2001
|
|
|
|
| Con |
-10.81% |
| Lab |
12.24% |
| LD |
-8.81% |
| SNP |
4.60% |
|
| Con |
3.34% |
| Lab |
-2.52% |
| LD |
0.77% |
| SNP |
-1.80% |
|
|
 |
John Thurso
Liberal Democrat hold
|
| Con |
 |
3,513 |
14.13% |
| Lab |
 |
6,297 |
25.32% |
| LD |
 |
9,041 |
36.36% |
| SNP |
 |
5,273 |
21.20% |
| Oth |
 |
743 |
2.99% |
| Maj |
 |
2,744 |
11.03% |
| Turn |
 |
24,867 |
60.32% |
|
|
 |
John Thurso
Liberal Democrat hold
|
| I |
Gordon Campbell |
199 |
0.80% |
| SSP |
Karn Mabon |
544 |
2.19% |
| SNP |
John Macadam |
5,273 |
21.20% |
| L |
Michael Meighan |
6,297 |
25.32% |
| C |
Robert Rowantree |
3,513 |
14.13% |
| LD |
John Thurso |
9,041 |
36.36% |
|
Candidates representing 6 parties stood for election to this seat.
|
|
 |
Robert Maclennan
Liberal Democrat
|
| Con |
 |
3,148 |
10.79% |
| Lab |
 |
8,122 |
27.84% |
| LD |
 |
10,381 |
35.59% |
| SNP |
 |
6,710 |
23.00% |
| Ref |
 |
369 |
1.26% |
| Oth |
 |
442 |
1.52% |
| Maj |
 |
2,259 |
7.74% |
| Turn |
 |
29,172 |
70.18% |
|
|
 |
|
Liberal Democrat
|
| Con |
 |
6,391 |
21.60% |
| Lab |
 |
4,629 |
15.60% |
| LD |
 |
13,150 |
44.40% |
| SNP |
 |
5,440 |
18.40% |
| Oth |
|
0 |
0.00% |
| Maj |
 |
6,759 |
22.80% |
| Turn |
 |
29,610 |
71.66% |
|
|
 |
|

|

