|
Calder Valley
Labour hold

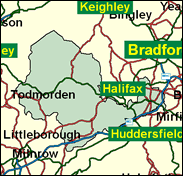
In 1997 the Labour supporting writer Pete Davies chose this West Yorkshire valley constituency as his focus for an impassioned book about the General Election campaign. It was a picturesque enough setting, as the Calder flowed east from the high Pennines through towns like Todmorden, Hebden Bridge and Mytholmroyd, set like beads on a chain between the hillsides; and it was appropriate too, for Labour's Christine McCafferty ousted Donald Thompson, Conservative MP throughout the long period of Thatcher/Major government, providing a significant contribution to the national triumph of New Labour. However, Labour did manage not to win any of the wards in this classic marginal Pennine constituency in the May 2000 local elections, and the Conservatives gained control of the local council from no overall control, this constituting half of their fourth highest Metropolitan Borough percentage increase in that year, the top three being in the West Midlands. This evidence suggests that Calder Valley should be seen as a genuine target for regain for the new Tory candidate, Sue Robson-Catling (a rare female in a winnable seat for that party). However, national elections pose different options from those in the traditionally hard-fought municipal politics of Calderdale, and Christine McCafferty probably starts favourite. Perhaps Pete Davies should write another book about the campaign here next time.

Christine McCafferty comes as a 1997 bog-standard issue Labour candidate launched by an all-women shortlist with a background as a local councillor and as a social worker - in her case at a 'Well Woman' centre. Born 1945, educated at Whalley Range Grammar School and in Australia, she has been mocked by Tory MPs for worrying about endangered bird life. A tabler of a mere 8 written questions in her first year, she is a keen advocate of family planning overseas, and of availability of abortion in this country, and a campaigner for lowered VAT on sanitary products.

 |
| Wealthy Achievers, Suburban Areas |
10.59% |
14.99% |
70.65 |
|
| Affluent Greys, Rural Communities |
0.01% |
2.13% |
0.24 |
|
| Prosperous Pensioners, Retirement Areas |
0.46% |
2.49% |
18.40 |
|
| Affluent Executives, Family Areas |
1.88% |
4.43% |
42.49 |
|
| Well-Off Workers, Family Areas |
11.34% |
7.27% |
155.96 |
|
| Affluent Urbanites, Town & City Areas |
0.19% |
2.56% |
7.29 |
|
| Prosperous Professionals, Metropolitan Areas |
0.00% |
2.04% |
0.00 |
|
| Better-Off Executives, Inner City Areas |
0.07% |
3.94% |
1.83 |
|
| Comfortable Middle Agers, Mature Home Owning Areas |
10.63% |
13.04% |
81.55 |
|
| Skilled Workers, Home Owning Areas |
34.82% |
12.70% |
274.08 |
|
| New Home Owners, Mature Communities |
8.08% |
8.14% |
99.17 |
|
| White Collar Workers, Better-Off Multi Ethnic Areas |
5.61% |
4.02% |
139.52 |
|
| Older People, Less Prosperous Areas |
5.13% |
3.19% |
161.07 |
|
| Council Estate Residents, Better-Off Homes |
8.75% |
11.31% |
77.37 |
|
| Council Estate Residents, High Unemployment |
1.48% |
3.06% |
48.36 |
|
| Council Estate Residents, Greatest Hardship |
0.93% |
2.52% |
37.02 |
|
| People in Multi-Ethnic, Low-Income Areas |
0.00% |
2.10% |
0.00 |
|
| Unclassified |
0.03% |
0.06% |
48.03 |
|
|
 |
 |
 |
| £0-5K |
9.59% |
9.41% |
101.83 |
|
| £5-10K |
16.62% |
16.63% |
99.90 |
|
| £10-15K |
16.66% |
16.58% |
100.49 |
|
| £15-20K |
13.74% |
13.58% |
101.16 |
|
| £20-25K |
10.55% |
10.39% |
101.47 |
|
| £25-30K |
7.88% |
7.77% |
101.37 |
|
| £30-35K |
5.85% |
5.79% |
100.95 |
|
| £35-40K |
4.35% |
4.33% |
100.29 |
|
| £40-45K |
3.25% |
3.27% |
99.47 |
|
| £45-50K |
2.45% |
2.48% |
98.53 |
|
| £50-55K |
1.86% |
1.90% |
97.54 |
|
| £55-60K |
1.42% |
1.47% |
96.50 |
|
| £60-65K |
1.10% |
1.15% |
95.46 |
|
| £65-70K |
0.86% |
0.91% |
94.42 |
|
| £70-75K |
0.67% |
0.72% |
93.40 |
|
| £75-80K |
0.53% |
0.57% |
92.39 |
|
| £80-85K |
0.42% |
0.46% |
91.41 |
|
| £85-90K |
0.34% |
0.37% |
90.46 |
|
| £90-95K |
0.27% |
0.31% |
89.54 |
|
| £95-100K |
0.22% |
0.25% |
88.64 |
|
| £100K + |
1.12% |
1.34% |
83.40 |
|
|
|

|


|
1992-1997
|
1997-2001
|
|
|
|
| Con |
-10.34% |
| Lab |
8.73% |
| LD |
-1.36% |
|
| Con |
1.11% |
| Lab |
-3.45% |
| LD |
1.28% |
|
|
 |
Christine McCafferty
Labour hold
|
| Con |
 |
17,150 |
36.16% |
| Lab |
 |
20,244 |
42.69% |
| LD |
 |
7,596 |
16.02% |
| Oth |
 |
2,435 |
5.13% |
| Maj |
 |
3,094 |
6.52% |
| Turn |
 |
47,425 |
62.98% |
|
|
 |
Christine McCafferty
Labour hold
|
| G |
Steve Hutton |
1,034 |
2.18% |
| LCA |
Philip Lockwood |
672 |
1.42% |
| L |
Christine McCafferty |
20,244 |
42.69% |
| UK |
John Nunn |
729 |
1.54% |
| C |
Sue Robson-Catling |
17,150 |
36.16% |
| LD |
Michael Taylor |
7,596 |
16.02% |
|
Candidates representing 6 parties stood for election to this seat.
|
|
 |
Christine McCafferty
Labour gain
|
| Con |
 |
19,795 |
35.06% |
| Lab |
 |
26,050 |
46.13% |
| LD |
 |
8,322 |
14.74% |
| Ref |
 |
1,380 |
2.44% |
| Oth |
 |
919 |
1.63% |
| Maj |
 |
6,255 |
11.08% |
| Turn |
 |
56,466 |
75.39% |
|
|
 |
|
Conservative
|
| Con |
 |
27,753 |
45.40% |
| Lab |
 |
22,875 |
37.40% |
| LD |
 |
9,842 |
16.10% |
| Oth |
 |
622 |
1.00% |
| Maj |
 |
4,878 |
8.00% |
| Turn |
 |
61,092 |
81.65% |
|
|
 |
|

|

