|
Camberwell & Peckham
Labour hold

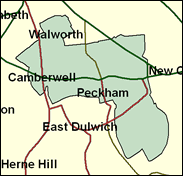
The smallest English seat, set in the southern part of the borough of Southwark but still very much in inner London, has continued to lose electors, and attracted notoriety in November 2000 with the murder of 10-year-old Damilola Taylor in the alleys of the nightmareish sink estate of North Peckham. This is one of the most multiply deprived areas in London and the whole of the UK, and mere party politics seems to pale into insignificance when cast in the shadows of life, or existence, here.

Harriet Harman, one of the Blair Government's most senior Cabinet casualties, sacked after a year at Social Security, had previously been a rising star since her election here in 1982. Daughter of a Harley Street consultant and a niece of the Countess of Longford, she was expensively educated at St Paul's Girls' School, before attending York University, working as a solicitor, and marrying the ex-Communist TGWU official Jack Dromey. She was damaged by having to carry through the Tory policy of lone parent benefit cuts, generating Labour's first big backbench revolt, and adding to her earlier spat with the activists over selective schooling of her children. Cruelly seen as arrogant, icy and an air-head, she was (according to Simon Hoggart) "not born but assembled in a lab by Peter Mandelson."

 |
| Wealthy Achievers, Suburban Areas |
0.00% |
14.99% |
0.00 |
|
| Affluent Greys, Rural Communities |
0.00% |
2.13% |
0.00 |
|
| Prosperous Pensioners, Retirement Areas |
0.00% |
2.49% |
0.00 |
|
| Affluent Executives, Family Areas |
0.00% |
4.43% |
0.00 |
|
| Well-Off Workers, Family Areas |
0.00% |
7.27% |
0.00 |
|
| Affluent Urbanites, Town & City Areas |
0.00% |
2.56% |
0.00 |
|
| Prosperous Professionals, Metropolitan Areas |
8.55% |
2.04% |
419.06 |
|
| Better-Off Executives, Inner City Areas |
8.56% |
3.94% |
217.09 |
|
| Comfortable Middle Agers, Mature Home Owning Areas |
0.00% |
13.04% |
0.00 |
|
| Skilled Workers, Home Owning Areas |
0.00% |
12.70% |
0.00 |
|
| New Home Owners, Mature Communities |
0.00% |
8.14% |
0.00 |
|
| White Collar Workers, Better-Off Multi Ethnic Areas |
8.77% |
4.02% |
218.15 |
|
| Older People, Less Prosperous Areas |
0.33% |
3.19% |
10.33 |
|
| Council Estate Residents, Better-Off Homes |
0.80% |
11.31% |
7.09 |
|
| Council Estate Residents, High Unemployment |
15.73% |
3.06% |
513.77 |
|
| Council Estate Residents, Greatest Hardship |
0.23% |
2.52% |
8.94 |
|
| People in Multi-Ethnic, Low-Income Areas |
57.02% |
2.10% |
2,715.42 |
|
| Unclassified |
0.00% |
0.06% |
0.00 |
|
|
 |
 |
 |
| £0-5K |
11.89% |
9.41% |
126.30 |
|
| £5-10K |
17.64% |
16.63% |
106.09 |
|
| £10-15K |
16.55% |
16.58% |
99.80 |
|
| £15-20K |
13.16% |
13.58% |
96.92 |
|
| £20-25K |
9.89% |
10.39% |
95.20 |
|
| £25-30K |
7.30% |
7.77% |
93.93 |
|
| £30-35K |
5.38% |
5.79% |
92.88 |
|
| £35-40K |
3.98% |
4.33% |
91.97 |
|
| £40-45K |
2.98% |
3.27% |
91.19 |
|
| £45-50K |
2.25% |
2.48% |
90.51 |
|
| £50-55K |
1.71% |
1.90% |
89.95 |
|
| £55-60K |
1.32% |
1.47% |
89.49 |
|
| £60-65K |
1.03% |
1.15% |
89.13 |
|
| £65-70K |
0.81% |
0.91% |
88.87 |
|
| £70-75K |
0.64% |
0.72% |
88.70 |
|
| £75-80K |
0.51% |
0.57% |
88.61 |
|
| £80-85K |
0.41% |
0.46% |
88.60 |
|
| £85-90K |
0.33% |
0.37% |
88.67 |
|
| £90-95K |
0.27% |
0.31% |
88.80 |
|
| £95-100K |
0.22% |
0.25% |
88.99 |
|
| £100K + |
1.24% |
1.34% |
92.48 |
|
|
|

|


|
1992-1997
|
1997-2001
|
|
|
|
| Con |
-11.92% |
| Lab |
8.91% |
| LD |
-3.87% |
|
| Con |
-0.97% |
| Lab |
0.30% |
| LD |
2.11% |
|
|
 |
Harriet Harman
Labour hold
|
| Con |
 |
2,740 |
10.91% |
| Lab |
 |
17,473 |
69.60% |
| LD |
 |
3,350 |
13.34% |
| Oth |
 |
1,541 |
6.14% |
| Maj |
 |
14,123 |
56.26% |
| Turn |
 |
25,104 |
33.34% |
|
|
 |
Harriet Harman
Labour hold
|
| SL |
Robert Adams |
188 |
0.75% |
| L |
Harriet Harman |
17,473 |
69.60% |
| LD |
Donnachadh McCarthy |
3,350 |
13.34% |
| C |
Jonathan Morgan |
2,740 |
10.91% |
| SA |
John Mulrenan |
478 |
1.90% |
| G |
Storm Poorun |
805 |
3.21% |
| WRP |
Frank Sweeney |
70 |
0.28% |
|
Candidates representing 7 parties stood for election to this seat.
|
|
 |
Harriet Harman
Labour
|
| Con |
 |
3,383 |
11.88% |
| Lab |
 |
19,734 |
69.31% |
| LD |
 |
3,198 |
11.23% |
| Ref |
 |
692 |
2.43% |
| Oth |
 |
1,467 |
5.15% |
| Maj |
 |
16,351 |
57.42% |
| Turn |
 |
28,474 |
56.71% |
|
|
 |
|
Labour
|
| Con |
 |
7,841 |
23.80% |
| Lab |
 |
19,891 |
60.40% |
| LD |
 |
4,974 |
15.10% |
| Oth |
 |
244 |
0.70% |
| Maj |
 |
12,050 |
36.60% |
| Turn |
 |
32,950 |
51.30% |
|
|
 |
|

|

