|
Cambridge
Labour hold

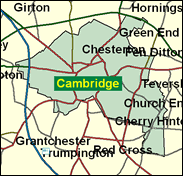
Always less industrial than Oxford, before 1992 Cambridge had only been won by Labour on those occasions when they have achieved a national landslide, such as 1966 (and even that was reversed after just a year in a by-election). Then in 1992 they produced one of their best results anywhere, as they leapt from third place to first, and Anne Campbell has subsequently advanced much further to a majority of 14,000 and an apparently safe seat. As in other towns noted for their universities, modern Conservatism seems to be far from their taste. This is not confined to Labour support, though (Oxford West elects a Liberal Democrat MP, Evan Harris); Cambridge City Council was one of only two Liberal Democrat gains of control in the May 2000 local elections (the other was Oldham Metropolitan Borough) but this reflects local activism rather than any serious challenge to the tenure of Labour MP Anne Campbell.

Ann Campbell, a steely blonde, serenely-smiling statistician, has held Cambridge since 1992 - the first ever Labour MP for the city to win it in consecutive elections. PPS to Patricia Hewitt, she is an utterly safe Blairite pair of hands, and apolitically keen on IT. Born 1940 and educated at Pennistone Grammar School and Newnham College Cambridge (reading Maths), she is appropriately keen on cycling. She salts her defence of Cambridge's unfashionably elitist University by reminding Labour Party populists of its 69 Nobel Prize winners, whilst seeking wider "access."

 |
| Wealthy Achievers, Suburban Areas |
2.91% |
14.99% |
19.39 |
|
| Affluent Greys, Rural Communities |
0.00% |
2.13% |
0.00 |
|
| Prosperous Pensioners, Retirement Areas |
1.85% |
2.49% |
74.32 |
|
| Affluent Executives, Family Areas |
1.36% |
4.43% |
30.73 |
|
| Well-Off Workers, Family Areas |
0.87% |
7.27% |
11.94 |
|
| Affluent Urbanites, Town & City Areas |
16.77% |
2.56% |
653.83 |
|
| Prosperous Professionals, Metropolitan Areas |
9.62% |
2.04% |
471.45 |
|
| Better-Off Executives, Inner City Areas |
15.78% |
3.94% |
400.03 |
|
| Comfortable Middle Agers, Mature Home Owning Areas |
10.00% |
13.04% |
76.67 |
|
| Skilled Workers, Home Owning Areas |
1.42% |
12.70% |
11.15 |
|
| New Home Owners, Mature Communities |
10.70% |
8.14% |
131.42 |
|
| White Collar Workers, Better-Off Multi Ethnic Areas |
7.24% |
4.02% |
180.11 |
|
| Older People, Less Prosperous Areas |
3.41% |
3.19% |
106.93 |
|
| Council Estate Residents, Better-Off Homes |
14.73% |
11.31% |
130.22 |
|
| Council Estate Residents, High Unemployment |
2.44% |
3.06% |
79.68 |
|
| Council Estate Residents, Greatest Hardship |
0.00% |
2.52% |
0.04 |
|
| People in Multi-Ethnic, Low-Income Areas |
0.00% |
2.10% |
0.00 |
|
| Unclassified |
0.92% |
0.06% |
1,469.34 |
|
|
 |
 |
 |
| £0-5K |
9.13% |
9.41% |
97.02 |
|
| £5-10K |
16.25% |
16.63% |
97.68 |
|
| £10-15K |
16.50% |
16.58% |
99.51 |
|
| £15-20K |
13.70% |
13.58% |
100.85 |
|
| £20-25K |
10.56% |
10.39% |
101.59 |
|
| £25-30K |
7.92% |
7.77% |
101.83 |
|
| £30-35K |
5.89% |
5.79% |
101.73 |
|
| £35-40K |
4.39% |
4.33% |
101.41 |
|
| £40-45K |
3.30% |
3.27% |
100.98 |
|
| £45-50K |
2.49% |
2.48% |
100.48 |
|
| £50-55K |
1.90% |
1.90% |
99.97 |
|
| £55-60K |
1.47% |
1.47% |
99.47 |
|
| £60-65K |
1.14% |
1.15% |
99.00 |
|
| £65-70K |
0.89% |
0.91% |
98.58 |
|
| £70-75K |
0.71% |
0.72% |
98.20 |
|
| £75-80K |
0.56% |
0.57% |
97.88 |
|
| £80-85K |
0.45% |
0.46% |
97.60 |
|
| £85-90K |
0.36% |
0.37% |
97.38 |
|
| £90-95K |
0.30% |
0.31% |
97.21 |
|
| £95-100K |
0.24% |
0.25% |
97.09 |
|
| £100K + |
1.32% |
1.34% |
98.05 |
|
|
|

|


|
1992-1997
|
1997-2001
|
|
|
|
| Con |
-12.60% |
| Lab |
13.74% |
| LD |
-3.76% |
|
| Con |
-2.96% |
| Lab |
-8.35% |
| LD |
8.92% |
|
|
 |
Anne Campbell
Labour hold
|
| Con |
 |
9,829 |
22.95% |
| Lab |
 |
19,316 |
45.09% |
| LD |
 |
10,737 |
25.07% |
| Oth |
 |
2,954 |
6.90% |
| Maj |
 |
8,579 |
20.03% |
| Turn |
 |
42,836 |
60.62% |
|
|
 |
Anne Campbell
Labour hold
|
| UK |
Len Baynes |
532 |
1.24% |
| L |
Anne Campbell |
19,316 |
45.09% |
| WRP |
Margaret Courtney |
61 |
0.14% |
| LD |
David Howarth |
10,737 |
25.07% |
| G |
Stephen Lawrence |
1,413 |
3.30% |
| SA |
Howard Senter |
716 |
1.67% |
| C |
Graham Stuart |
9,829 |
22.95% |
| P |
Clare Underwood |
232 |
0.54% |
|
Candidates representing 8 parties stood for election to this seat.
|
|
 |
Anne Campbell
Labour
|
| Con |
 |
13,299 |
25.90% |
| Lab |
 |
27,436 |
53.44% |
| LD |
 |
8,287 |
16.14% |
| Ref |
 |
1,262 |
2.46% |
| Oth |
 |
1,055 |
2.05% |
| Maj |
 |
14,137 |
27.54% |
| Turn |
 |
51,339 |
71.63% |
|
|
 |
|
Labour
|
| Con |
 |
19,459 |
38.50% |
| Lab |
 |
20,039 |
39.70% |
| LD |
 |
10,037 |
19.90% |
| Oth |
 |
978 |
1.90% |
| Maj |
 |
580 |
1.10% |
| Turn |
 |
50,513 |
73.23% |
|
|
 |
|

|

