|
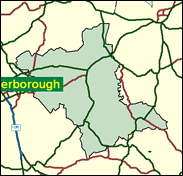
Cambridgeshire North East
Conservative hold

From 1973 to 1987, this Fenland seat, originally called Isle of Ely, was held by the Liberal Clement Freud, mainly because of the initial quirk of a by-election at a time when his party were sweeping before them. Following the strength of his personality, distinctive and not to everybody's taste, the voters returned him to Parliament three more times. Once he had been beaten by the Conservative Malcolm Moss, though, the Liberal Democrats have slipped back steeply, and it was Labour who advanced by 20pc in 1997 to seize second place, but still scarcely to challenge Moss in the flatlands around Wisbech, March, Chatteris and Whittlesey.

Malcolm Moss, a Conservative Agriculture spokesman (and former Northern Ireland minister) was elected in 1987 when he dispatched the exotic Liberal MP Clement Freud. Born in 1943, educated at Audenshaw Grammar School and St John's College Cambridge, he was briefly a public schoolmaster before turning to insurance. A big affable man of rightist hue he has been low-profiled in opposition by his Europhilia, though he backed Hague in the leadership ballots. He has piloted through legislation on the registration of osteopaths.

 |
| Wealthy Achievers, Suburban Areas |
11.86% |
14.99% |
79.13 |
|
| Affluent Greys, Rural Communities |
7.52% |
2.13% |
353.49 |
|
| Prosperous Pensioners, Retirement Areas |
4.12% |
2.49% |
165.75 |
|
| Affluent Executives, Family Areas |
1.59% |
4.43% |
35.93 |
|
| Well-Off Workers, Family Areas |
7.00% |
7.27% |
96.26 |
|
| Affluent Urbanites, Town & City Areas |
0.08% |
2.56% |
3.28 |
|
| Prosperous Professionals, Metropolitan Areas |
0.00% |
2.04% |
0.00 |
|
| Better-Off Executives, Inner City Areas |
0.14% |
3.94% |
3.53 |
|
| Comfortable Middle Agers, Mature Home Owning Areas |
34.43% |
13.04% |
264.08 |
|
| Skilled Workers, Home Owning Areas |
13.62% |
12.70% |
107.18 |
|
| New Home Owners, Mature Communities |
11.43% |
8.14% |
140.38 |
|
| White Collar Workers, Better-Off Multi Ethnic Areas |
0.83% |
4.02% |
20.61 |
|
| Older People, Less Prosperous Areas |
3.17% |
3.19% |
99.41 |
|
| Council Estate Residents, Better-Off Homes |
3.48% |
11.31% |
30.75 |
|
| Council Estate Residents, High Unemployment |
0.05% |
3.06% |
1.74 |
|
| Council Estate Residents, Greatest Hardship |
0.68% |
2.52% |
26.87 |
|
| People in Multi-Ethnic, Low-Income Areas |
0.00% |
2.10% |
0.00 |
|
| Unclassified |
0.00% |
0.06% |
0.00 |
|
|
 |
 |
 |
| £0-5K |
9.97% |
9.41% |
105.91 |
|
| £5-10K |
18.19% |
16.63% |
109.37 |
|
| £10-15K |
18.11% |
16.58% |
109.26 |
|
| £15-20K |
14.52% |
13.58% |
106.91 |
|
| £20-25K |
10.74% |
10.39% |
103.30 |
|
| £25-30K |
7.70% |
7.77% |
99.07 |
|
| £30-35K |
5.48% |
5.79% |
94.63 |
|
| £35-40K |
3.91% |
4.33% |
90.20 |
|
| £40-45K |
2.81% |
3.27% |
85.92 |
|
| £45-50K |
2.03% |
2.48% |
81.86 |
|
| £50-55K |
1.49% |
1.90% |
78.05 |
|
| £55-60K |
1.10% |
1.47% |
74.50 |
|
| £60-65K |
0.82% |
1.15% |
71.20 |
|
| £65-70K |
0.62% |
0.91% |
68.14 |
|
| £70-75K |
0.47% |
0.72% |
65.31 |
|
| £75-80K |
0.36% |
0.57% |
62.68 |
|
| £80-85K |
0.28% |
0.46% |
60.24 |
|
| £85-90K |
0.22% |
0.37% |
57.98 |
|
| £90-95K |
0.17% |
0.31% |
55.87 |
|
| £95-100K |
0.13% |
0.25% |
53.91 |
|
| £100K + |
0.60% |
1.34% |
44.29 |
|
|
|

|


|
1992-1997
|
1997-2001
|
|
|
|
| Con |
-10.46% |
| Lab |
20.24% |
| LD |
-14.54% |
|
| Con |
5.10% |
| Lab |
1.04% |
| LD |
-2.35% |
|
|
 |
Malcolm Moss
Conservative hold
|
| Con |
 |
23,132 |
48.14% |
| Lab |
 |
16,759 |
34.88% |
| LD |
 |
6,733 |
14.01% |
| Oth |
 |
1,427 |
2.97% |
| Maj |
 |
6,373 |
13.26% |
| Turn |
 |
48,051 |
60.15% |
|
|
 |
Malcolm Moss
Conservative hold
|
| P |
Tony Hoey |
238 |
0.50% |
| C |
Malcolm Moss |
23,132 |
48.14% |
| L |
Dil Owen |
16,759 |
34.88% |
| LD |
Richard Renaut |
6,733 |
14.01% |
| UK |
John Stevens |
1,189 |
2.47% |
|
Candidates representing 5 parties stood for election to this seat.
|
|
 |
Malcolm Moss
Conservative
|
| Con |
 |
23,855 |
43.04% |
| Lab |
 |
18,754 |
33.84% |
| LD |
 |
9,070 |
16.36% |
| Ref |
 |
2,636 |
4.76% |
| Oth |
 |
1,110 |
2.00% |
| Maj |
 |
5,101 |
9.20% |
| Turn |
 |
55,425 |
72.87% |
|
|
 |
|
Conservative
|
| Con |
 |
31,168 |
53.50% |
| Lab |
 |
7,928 |
13.60% |
| LD |
 |
18,007 |
30.90% |
| Oth |
 |
1,136 |
2.00% |
| Maj |
 |
13,161 |
22.60% |
| Turn |
 |
58,239 |
79.77% |
|
|
 |
|

|

