|
Cambridgeshire South East
Conservative hold

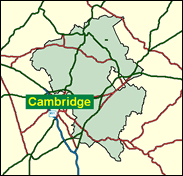
Labour can hardly do well here in the farming and light industrial economy of South East Cambridgeshire, which also now includes the small cathedral city of Ely, standing on a slight rise above the former Fenland; and although the Liberal Democrats control East Cambridgeshire council, which covers most of the ground in this constituency, they signally failed to translate this into general election votes in 1997, finishing in third place. Indeed the opposition to the Conservative MP James Paice was almost equally divided in 1997, so that even in a dreadful year for the Tories they still won by over 9,000, making this one of their 40 or 50 safest seats.

James Paice, an agriculture spokesman and former Employment minister, elected here in 1987, born 1949 and educated at Framlingham College and Writtle College of Agriculture, is a small farmer. Tall blond, balding and with classless speech, he is out of step as one who has said that "the European ideal was the reason I originally came into politics" and for backing Maastricht as an "unashamed supporter." But, like his Cambridgeshire colleague, Malcolm Moss who sits with him on the Opposition frontbench Agriculture team, he prudently backed Hague in the 1997 leadership ballots. He rejects right-to-roam legislation as "totally socialist" and though he doesn't hunt he strongly defends his important local blood-stock industry.

 |
| Wealthy Achievers, Suburban Areas |
33.91% |
14.99% |
226.15 |
|
| Affluent Greys, Rural Communities |
1.01% |
2.13% |
47.47 |
|
| Prosperous Pensioners, Retirement Areas |
0.88% |
2.49% |
35.49 |
|
| Affluent Executives, Family Areas |
10.45% |
4.43% |
236.15 |
|
| Well-Off Workers, Family Areas |
8.08% |
7.27% |
111.03 |
|
| Affluent Urbanites, Town & City Areas |
0.92% |
2.56% |
35.87 |
|
| Prosperous Professionals, Metropolitan Areas |
0.00% |
2.04% |
0.00 |
|
| Better-Off Executives, Inner City Areas |
0.25% |
3.94% |
6.44 |
|
| Comfortable Middle Agers, Mature Home Owning Areas |
30.42% |
13.04% |
233.31 |
|
| Skilled Workers, Home Owning Areas |
3.80% |
12.70% |
29.89 |
|
| New Home Owners, Mature Communities |
6.95% |
8.14% |
85.32 |
|
| White Collar Workers, Better-Off Multi Ethnic Areas |
1.36% |
4.02% |
33.88 |
|
| Older People, Less Prosperous Areas |
1.36% |
3.19% |
42.61 |
|
| Council Estate Residents, Better-Off Homes |
0.61% |
11.31% |
5.43 |
|
| Council Estate Residents, High Unemployment |
0.00% |
3.06% |
0.00 |
|
| Council Estate Residents, Greatest Hardship |
0.00% |
2.52% |
0.00 |
|
| People in Multi-Ethnic, Low-Income Areas |
0.00% |
2.10% |
0.00 |
|
| Unclassified |
0.00% |
0.06% |
1.43 |
|
|
 |
 |
 |
| £0-5K |
6.71% |
9.41% |
71.31 |
|
| £5-10K |
13.42% |
16.63% |
80.66 |
|
| £10-15K |
15.09% |
16.58% |
91.05 |
|
| £15-20K |
13.59% |
13.58% |
100.06 |
|
| £20-25K |
11.14% |
10.39% |
107.23 |
|
| £25-30K |
8.76% |
7.77% |
112.71 |
|
| £30-35K |
6.77% |
5.79% |
116.84 |
|
| £35-40K |
5.20% |
4.33% |
119.91 |
|
| £40-45K |
3.99% |
3.27% |
122.17 |
|
| £45-50K |
3.07% |
2.48% |
123.83 |
|
| £50-55K |
2.38% |
1.90% |
125.02 |
|
| £55-60K |
1.86% |
1.47% |
125.85 |
|
| £60-65K |
1.46% |
1.15% |
126.42 |
|
| £65-70K |
1.15% |
0.91% |
126.77 |
|
| £70-75K |
0.91% |
0.72% |
126.96 |
|
| £75-80K |
0.73% |
0.57% |
127.02 |
|
| £80-85K |
0.59% |
0.46% |
126.98 |
|
| £85-90K |
0.48% |
0.37% |
126.86 |
|
| £90-95K |
0.39% |
0.31% |
126.67 |
|
| £95-100K |
0.32% |
0.25% |
126.44 |
|
| £100K + |
1.66% |
1.34% |
123.74 |
|
|
|

|


|
1992-1997
|
1997-2001
|
|
|
|
| Con |
-14.55% |
| Lab |
6.99% |
| LD |
3.88% |
|
| Con |
0.88% |
| Lab |
-0.28% |
| LD |
1.56% |
|
|
 |
James Paice
Conservative hold
|
| Con |
 |
22,927 |
43.82% |
| Lab |
 |
13,714 |
26.21% |
| LD |
 |
13,937 |
26.64% |
| Oth |
 |
1,737 |
3.32% |
| Maj |
 |
8,990 |
17.18% |
| Turn |
 |
52,315 |
64.06% |
|
|
 |
James Paice
Conservative hold
|
| LD |
Sal Brinton |
13,937 |
26.64% |
| Ind |
David Hall |
429 |
0.82% |
| L |
Andrew Inchley |
13,714 |
26.21% |
| C |
James Paice |
22,927 |
43.82% |
| UK |
Neil Scarr |
1,308 |
2.50% |
|
Candidates representing 5 parties stood for election to this seat.
|
|
 |
Jim Paice
Conservative
|
| Con |
 |
24,397 |
42.95% |
| Lab |
 |
15,048 |
26.49% |
| LD |
 |
14,246 |
25.08% |
| Ref |
 |
2,838 |
5.00% |
| Oth |
 |
278 |
0.49% |
| Maj |
 |
9,349 |
16.46% |
| Turn |
 |
56,807 |
75.08% |
|
|
 |
|
Conservative
|
| Con |
 |
33,080 |
57.50% |
| Lab |
 |
11,205 |
19.50% |
| LD |
 |
12,217 |
21.20% |
| Oth |
 |
1,050 |
1.80% |
| Maj |
 |
20,863 |
36.30% |
| Turn |
 |
57,552 |
80.30% |
|
|
 |
|

|

