|
Cardiff Central
Labour hold

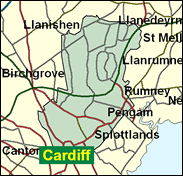
In the Welsh Assembly elections, constituency section, of May 1999 Cardiff Central produced a surprise result. The Liberal Democrat Jenny Randerson won by over 3,000 from Labour, and in this interesting and varied seat at the heart of the principality's capital the nationally governing party must watch out very carefully. This is one of the very few Labour - Liberal Democrat marginals in Britain, and in all probability the latter's best chance of a gain in Wales. The Conservatives held this seat until 1992, but seem to have become disorganised over the past decade; nevertheless, should Labour stumble in a major way, it is possible to imagine a three-way fight re-emerging.

Jon Owen Jones, a bearded Welsh-speaking biology teacher before winning here in 1992, joined the ranks of Blair's discarded ministers in 1999, when dropped from the slimmed-down post-devolution Welsh Office. Born 1954 in the Rhondda and educated at Ysgol Cymraeg, Pontygwaith, and at East Anglia University, he has campaigned for more public lavatories for women and for prompt payment of debts to small businesses, but in 2000 he belied his 5 years as a Labour Whip by rebelling on the Freedom of Information bill.

 |
| Wealthy Achievers, Suburban Areas |
17.11% |
14.99% |
114.14 |
|
| Affluent Greys, Rural Communities |
0.15% |
2.13% |
6.99 |
|
| Prosperous Pensioners, Retirement Areas |
1.11% |
2.49% |
44.60 |
|
| Affluent Executives, Family Areas |
3.94% |
4.43% |
88.95 |
|
| Well-Off Workers, Family Areas |
6.09% |
7.27% |
83.71 |
|
| Affluent Urbanites, Town & City Areas |
9.50% |
2.56% |
370.56 |
|
| Prosperous Professionals, Metropolitan Areas |
0.98% |
2.04% |
48.08 |
|
| Better-Off Executives, Inner City Areas |
26.79% |
3.94% |
679.42 |
|
| Comfortable Middle Agers, Mature Home Owning Areas |
2.54% |
13.04% |
19.45 |
|
| Skilled Workers, Home Owning Areas |
7.93% |
12.70% |
62.46 |
|
| New Home Owners, Mature Communities |
0.26% |
8.14% |
3.17 |
|
| White Collar Workers, Better-Off Multi Ethnic Areas |
11.27% |
4.02% |
280.30 |
|
| Older People, Less Prosperous Areas |
0.63% |
3.19% |
19.66 |
|
| Council Estate Residents, Better-Off Homes |
8.95% |
11.31% |
79.17 |
|
| Council Estate Residents, High Unemployment |
0.67% |
3.06% |
21.76 |
|
| Council Estate Residents, Greatest Hardship |
1.69% |
2.52% |
67.16 |
|
| People in Multi-Ethnic, Low-Income Areas |
0.15% |
2.10% |
7.30 |
|
| Unclassified |
0.23% |
0.06% |
370.84 |
|
|
 |
 |
 |
| £0-5K |
9.43% |
9.41% |
100.19 |
|
| £5-10K |
16.06% |
16.63% |
96.55 |
|
| £10-15K |
16.30% |
16.58% |
98.33 |
|
| £15-20K |
13.61% |
13.58% |
100.22 |
|
| £20-25K |
10.56% |
10.39% |
101.58 |
|
| £25-30K |
7.96% |
7.77% |
102.40 |
|
| £30-35K |
5.95% |
5.79% |
102.78 |
|
| £35-40K |
4.46% |
4.33% |
102.84 |
|
| £40-45K |
3.35% |
3.27% |
102.65 |
|
| £45-50K |
2.54% |
2.48% |
102.29 |
|
| £50-55K |
1.94% |
1.90% |
101.81 |
|
| £55-60K |
1.49% |
1.47% |
101.25 |
|
| £60-65K |
1.16% |
1.15% |
100.65 |
|
| £65-70K |
0.91% |
0.91% |
100.01 |
|
| £70-75K |
0.71% |
0.72% |
99.37 |
|
| £75-80K |
0.57% |
0.57% |
98.72 |
|
| £80-85K |
0.45% |
0.46% |
98.08 |
|
| £85-90K |
0.36% |
0.37% |
97.45 |
|
| £90-95K |
0.30% |
0.31% |
96.83 |
|
| £95-100K |
0.24% |
0.25% |
96.23 |
|
| £100K + |
1.25% |
1.34% |
92.74 |
|
|
|

|


|
1992-1997
|
1997-2001
|
|
|
|
| Con |
-13.85% |
| Lab |
1.70% |
| LD |
3.55% |
| PC |
1.86% |
|
| Con |
-4.15% |
| Lab |
-5.09% |
| LD |
11.77% |
| PC |
1.26% |
|
|
 |
Jon Owen Jones
Labour hold
|
| Con |
 |
5,537 |
15.89% |
| Lab |
 |
13,451 |
38.61% |
| LD |
 |
12,792 |
36.71% |
| PC |
 |
1,680 |
4.82% |
| Oth |
 |
1,382 |
3.97% |
| Maj |
 |
659 |
1.89% |
| Turn |
 |
34,842 |
58.28% |
|
|
 |
Jon Owen Jones
Labour hold
|
| G |
Stephen Bartley |
661 |
1.90% |
| SA |
Julian Goss |
283 |
0.81% |
| PC |
Richard Grigg |
1,680 |
4.82% |
| UK |
Frank Hughes |
221 |
0.63% |
| P |
Madeleine Jeremy |
217 |
0.62% |
| LC |
Jon Owen Jones |
13,451 |
38.61% |
| C |
Gregory Walker |
5,537 |
15.89% |
| LD |
Jenny Willott |
12,792 |
36.71% |
|
Candidates representing 8 parties stood for election to this seat.
|
|
 |
Jon Owen Jones
Labour
|
| Con |
 |
8,470 |
20.05% |
| Lab |
 |
18,464 |
43.70% |
| LD |
 |
10,541 |
24.95% |
| PC |
 |
1,504 |
3.56% |
| Ref |
 |
760 |
1.80% |
| Oth |
 |
2,514 |
5.95% |
| Maj |
 |
7,923 |
18.75% |
| Turn |
 |
42,253 |
70.01% |
|
|
 |
|
Labour
|
| Con |
 |
14,549 |
33.90% |
| Lab |
 |
18,014 |
42.00% |
| LD |
 |
9,170 |
21.40% |
| PC |
 |
748 |
1.70% |
| Oth |
 |
435 |
1.00% |
| Maj |
 |
3,465 |
8.10% |
| Turn |
 |
42,916 |
73.08% |
|
|
 |
|

|

