|
Cardiff North
Labour hold

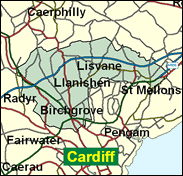
Although the Conservatives would still reckon North to be their strongest seat in Cardiff, Labour's win here in the Assembly poll in 1999 suggests that they are favourites to hold on at the next General Election. Julie Morgan, Rhodri's wife, did well to oust the 13 year incumbent Gwilym Jones from a constituency which covers Cardiff's swathe of owner occupied, middle class suburbs such as Heath Park, Rhiwbina and Whitchurch, where the HQ of the Tory Party in Wales is situated. This seat is over 70pc middle class in terms of non-manual residents, this figure undoubtedly boosted as in Cardiff Central by civil servants in the various tiers of local government in the principality's capital. Yet this public sector emphasis probably suits New Labour much better than the Conservatives, and Julie Morgan should hold on fairly easily barring unforeseeen disasters.

Julie Morgan, part of five Commons husband and wife pairs, is about to be politically separated from her husband Rhodri as he departs full-time for the Welsh Assembly as First Minister. Selected here on an all women shortlist, she has campaigned for women's issues and welcomed the selection of a black woman candidate in the Welsh Assembly election at Monmouth, a seat the party duly lost. Born 1944 and educated at Howells School, Llandaff (a private school) and at King's College London and Manchester and Cardiff Universities, she was a social worker, eventually with Dr. Barnardos. In 1999 she upped her profile by rebelling on disability benefit cuts.

 |
| Wealthy Achievers, Suburban Areas |
32.13% |
14.99% |
214.28 |
|
| Affluent Greys, Rural Communities |
0.00% |
2.13% |
0.00 |
|
| Prosperous Pensioners, Retirement Areas |
2.68% |
2.49% |
107.86 |
|
| Affluent Executives, Family Areas |
8.33% |
4.43% |
188.20 |
|
| Well-Off Workers, Family Areas |
3.43% |
7.27% |
47.21 |
|
| Affluent Urbanites, Town & City Areas |
2.60% |
2.56% |
101.41 |
|
| Prosperous Professionals, Metropolitan Areas |
0.20% |
2.04% |
9.57 |
|
| Better-Off Executives, Inner City Areas |
0.24% |
3.94% |
6.09 |
|
| Comfortable Middle Agers, Mature Home Owning Areas |
23.74% |
13.04% |
182.05 |
|
| Skilled Workers, Home Owning Areas |
5.58% |
12.70% |
43.94 |
|
| New Home Owners, Mature Communities |
11.14% |
8.14% |
136.80 |
|
| White Collar Workers, Better-Off Multi Ethnic Areas |
4.92% |
4.02% |
122.28 |
|
| Older People, Less Prosperous Areas |
1.31% |
3.19% |
41.27 |
|
| Council Estate Residents, Better-Off Homes |
3.10% |
11.31% |
27.40 |
|
| Council Estate Residents, High Unemployment |
0.60% |
3.06% |
19.62 |
|
| Council Estate Residents, Greatest Hardship |
0.00% |
2.52% |
0.00 |
|
| People in Multi-Ethnic, Low-Income Areas |
0.00% |
2.10% |
0.00 |
|
| Unclassified |
0.00% |
0.06% |
0.00 |
|
|
 |
 |
 |
| £0-5K |
7.16% |
9.41% |
76.05 |
|
| £5-10K |
14.20% |
16.63% |
85.35 |
|
| £10-15K |
15.48% |
16.58% |
93.36 |
|
| £15-20K |
13.54% |
13.58% |
99.70 |
|
| £20-25K |
10.88% |
10.39% |
104.64 |
|
| £25-30K |
8.43% |
7.77% |
108.48 |
|
| £30-35K |
6.45% |
5.79% |
111.41 |
|
| £35-40K |
4.92% |
4.33% |
113.60 |
|
| £40-45K |
3.76% |
3.27% |
115.19 |
|
| £45-50K |
2.89% |
2.48% |
116.30 |
|
| £50-55K |
2.23% |
1.90% |
117.00 |
|
| £55-60K |
1.73% |
1.47% |
117.40 |
|
| £60-65K |
1.35% |
1.15% |
117.54 |
|
| £65-70K |
1.06% |
0.91% |
117.48 |
|
| £70-75K |
0.84% |
0.72% |
117.26 |
|
| £75-80K |
0.67% |
0.57% |
116.90 |
|
| £80-85K |
0.54% |
0.46% |
116.45 |
|
| £85-90K |
0.43% |
0.37% |
115.91 |
|
| £90-95K |
0.35% |
0.31% |
115.31 |
|
| £95-100K |
0.29% |
0.25% |
114.66 |
|
| £100K + |
1.47% |
1.34% |
109.05 |
|
|
|

|


|
1992-1997
|
1997-2001
|
|
|
|
| Con |
-11.41% |
| Lab |
11.55% |
| LD |
-2.68% |
| PC |
0.58% |
|
| Con |
-2.05% |
| Lab |
-4.55% |
| LD |
4.42% |
| PC |
3.24% |
|
|
 |
Julie Morgan
Labour hold
|
| Con |
 |
13,680 |
31.64% |
| Lab |
 |
19,845 |
45.90% |
| LD |
 |
6,631 |
15.34% |
| PC |
 |
2,471 |
5.71% |
| Oth |
 |
613 |
1.42% |
| Maj |
 |
6,165 |
14.26% |
| Turn |
 |
43,240 |
69.04% |
|
|
 |
Julie Morgan
Labour hold
|
| LD |
John Dixon |
6,631 |
15.34% |
| UK |
Don Hulston |
613 |
1.42% |
| PC |
Sion Jobbins |
2,471 |
5.71% |
| L |
Julie Morgan |
19,845 |
45.90% |
| C |
Alastair Watson |
13,680 |
31.64% |
|
Candidates representing 5 parties stood for election to this seat.
|
|
 |
Julie Morgan
Labour gain
|
| Con |
 |
16,334 |
33.69% |
| Lab |
 |
24,460 |
50.45% |
| LD |
 |
5,294 |
10.92% |
| PC |
 |
1,201 |
2.48% |
| Ref |
 |
1,199 |
2.47% |
| Oth |
|
0 |
0.00% |
| Maj |
 |
8,126 |
16.76% |
| Turn |
 |
48,488 |
80.24% |
|
|
 |
|
Conservative
|
| Con |
 |
21,547 |
45.10% |
| Lab |
 |
18,578 |
38.90% |
| LD |
 |
6,487 |
13.60% |
| PC |
 |
916 |
1.90% |
| Oth |
 |
207 |
0.40% |
| Maj |
 |
2,969 |
6.20% |
| Turn |
 |
47,735 |
83.42% |
|
|
 |
|

|

