|
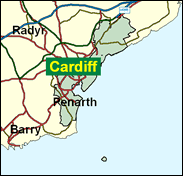
Cardiff South & Penarth
Conservative gain

One of Labour's safest holds in the 1999 Welsh assembly elections, there is virtually no Plaid Cymru threat here in a seat where only 4pc of the population aged over three years can speak any Welsh. Alun Michael, after the undignified saga of his alleged attempted imposition by the central Labour Party machine, will contest this seat at Westminster again. This is the linear successor to James Callaghan's Cardiff South East, which he represented as the last Labour Prime Minister before Tony Blair, as long ago as 1976-79.

Alun Michael, elected here as Lord Callaghan's successor in 1987, was enjoying a successful career as Welsh Secretary (1998-99), until asked by Blair to contest the election for Welsh First Minister in 1999 against the unreliable maverick, Rhodri Morgan, and though he won, he did so in a weighted electoral college and was eventually replaced by Morgan anyway in February 2000. Born 1943 and educated at Colwyn Bay Grammar School and at Keele University, where he was not politically involved, lacking charisma, and seen by his son Geraint as "boring", he now approaches his 59th year with a stalled career unlikely to be resumed, a casualty of devolution.

 |
| Wealthy Achievers, Suburban Areas |
3.62% |
14.99% |
24.16 |
|
| Affluent Greys, Rural Communities |
0.00% |
2.13% |
0.00 |
|
| Prosperous Pensioners, Retirement Areas |
0.71% |
2.49% |
28.65 |
|
| Affluent Executives, Family Areas |
4.33% |
4.43% |
97.93 |
|
| Well-Off Workers, Family Areas |
3.91% |
7.27% |
53.71 |
|
| Affluent Urbanites, Town & City Areas |
3.71% |
2.56% |
144.71 |
|
| Prosperous Professionals, Metropolitan Areas |
0.06% |
2.04% |
3.15 |
|
| Better-Off Executives, Inner City Areas |
2.35% |
3.94% |
59.54 |
|
| Comfortable Middle Agers, Mature Home Owning Areas |
15.46% |
13.04% |
118.57 |
|
| Skilled Workers, Home Owning Areas |
18.73% |
12.70% |
147.44 |
|
| New Home Owners, Mature Communities |
12.16% |
8.14% |
149.32 |
|
| White Collar Workers, Better-Off Multi Ethnic Areas |
5.73% |
4.02% |
142.43 |
|
| Older People, Less Prosperous Areas |
2.68% |
3.19% |
84.01 |
|
| Council Estate Residents, Better-Off Homes |
16.33% |
11.31% |
144.39 |
|
| Council Estate Residents, High Unemployment |
0.85% |
3.06% |
27.71 |
|
| Council Estate Residents, Greatest Hardship |
6.70% |
2.52% |
266.06 |
|
| People in Multi-Ethnic, Low-Income Areas |
2.66% |
2.10% |
126.83 |
|
| Unclassified |
0.01% |
0.06% |
8.60 |
|
|
 |
 |
 |
| £0-5K |
11.67% |
9.41% |
123.93 |
|
| £5-10K |
19.78% |
16.63% |
118.92 |
|
| £10-15K |
18.37% |
16.58% |
110.82 |
|
| £15-20K |
13.90% |
13.58% |
102.33 |
|
| £20-25K |
9.84% |
10.39% |
94.66 |
|
| £25-30K |
6.84% |
7.77% |
88.03 |
|
| £30-35K |
4.77% |
5.79% |
82.37 |
|
| £35-40K |
3.36% |
4.33% |
77.56 |
|
| £40-45K |
2.40% |
3.27% |
73.44 |
|
| £45-50K |
1.73% |
2.48% |
69.89 |
|
| £50-55K |
1.27% |
1.90% |
66.81 |
|
| £55-60K |
0.95% |
1.47% |
64.13 |
|
| £60-65K |
0.71% |
1.15% |
61.77 |
|
| £65-70K |
0.54% |
0.91% |
59.69 |
|
| £70-75K |
0.42% |
0.72% |
57.84 |
|
| £75-80K |
0.32% |
0.57% |
56.19 |
|
| £80-85K |
0.25% |
0.46% |
54.71 |
|
| £85-90K |
0.20% |
0.37% |
53.38 |
|
| £90-95K |
0.16% |
0.31% |
52.18 |
|
| £95-100K |
0.13% |
0.25% |
51.09 |
|
| £100K + |
0.62% |
1.34% |
46.29 |
|
|
|

|


|
1992-1997
|
1997-2001
|
|
|
|
| Con |
-12.93% |
| Lab |
-2.09% |
| LD |
1.55% |
| PC |
1.60% |
|
| Con |
1.16% |
| Lab |
-53.41% |
| LD |
3.44% |
| PC |
2.35% |
|
|
 |
Alun Michael
Conservative gain
|
| Con |
 |
7,807 |
21.84% |
| Lab |
|
0 |
0.00% |
| LD |
 |
4,572 |
12.79% |
| PC |
 |
1,983 |
5.55% |
| Oth |
 |
21,389 |
59.83% |
| Maj |
 |
3,235 |
9.05% |
| Turn |
 |
35,751 |
57.55% |
|
|
 |
Alun Michael
Conservative gain
|
| SA |
Dave Bartlett |
427 |
1.19% |
| LD |
Rodneu Berman |
4,572 |
12.79% |
| UK |
Justin Callan |
501 |
1.40% |
| PC |
Lila Haines |
1,983 |
5.55% |
| C |
Maureen Kelly Owen |
7,807 |
21.84% |
| LC |
Alun Michael |
20,094 |
56.21% |
| P |
Anne Savoury |
367 |
1.03% |
|
Candidates representing 7 parties stood for election to this seat.
|
|
 |
Alun Michael
Labour
|
| Con |
 |
8,766 |
20.67% |
| Lab |
 |
22,647 |
53.41% |
| LD |
 |
3,964 |
9.35% |
| PC |
 |
1,356 |
3.20% |
| Ref |
 |
1,211 |
2.86% |
| Oth |
 |
4,456 |
10.51% |
| Maj |
 |
13,881 |
32.74% |
| Turn |
 |
42,400 |
68.57% |
|
|
 |
|
Labour
|
| Con |
 |
15,958 |
33.60% |
| Lab |
 |
26,383 |
55.50% |
| LD |
 |
3,707 |
7.80% |
| PC |
 |
776 |
1.60% |
| Oth |
 |
676 |
1.40% |
| Maj |
 |
10,425 |
21.90% |
| Turn |
 |
47,500 |
76.35% |
|
|
 |
|

|

