|
Cardiff West
Labour hold

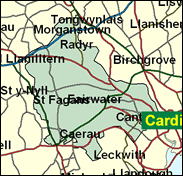
Rhodri Morgan was returned by Cardiff West with the largest and safest majority of any Labour member to the Welsh assembly which he has led since February 2000, and will pass on the seat to Kevin Brennan at the next General Election. This seat was held for 38 years from 1945 to 1983 by George Thomas, who became the second Labour Speaker (not that he was known for favouring the party which brought him to prominence) and then Lord Tonypandy. From 1983 to 1987 it was aberrantly held by an unuusal Conservative, Stefan Terlezki, who was born in the Ukraine, but that was during the depths of Labour troubles. Although it contains the attractive area around Llandaff Cathedral, more typical is the fearsome council estate of Ely, and this now seems one of Labour's strongest seats, immune from the Nationalism which has even reached the South Wales valleys of late.

With the departure of the tousled oddball Welsh First Minister, Rhodri Morgan, Kevin Brennan is Labour's unsurprising new shoe-in here, having carried Rhodri Morgan's bags as his adviser for 5 years, been chairman of the local CLP for 2 years, and a Cardiff councillor for 9 years. Yet another Welshman of Irish origins, to join Paul Murphy, Don Touhig, and Paul Flynn, he was born 1959, educated at St Albans (RC) Comprehensive School, Pontypool, Pembroke College Oxford, and at the Universities of Cardiff and Glamorgan. A teacher for 9 years, he is the son of a steel worker and a retired dinner lady, and reflects the now common background of Labour candidates in Wales: teachers who are one or two generations away from pit or steelworks. In the Young Communist League as a youthful dalliance in 1975, he was President of the Oxford Union the term after William Hague in 1982, and campaigned for PR for the Welsh Assembly elections.

 |
| Wealthy Achievers, Suburban Areas |
10.57% |
14.99% |
70.47 |
|
| Affluent Greys, Rural Communities |
0.00% |
2.13% |
0.00 |
|
| Prosperous Pensioners, Retirement Areas |
0.14% |
2.49% |
5.58 |
|
| Affluent Executives, Family Areas |
6.94% |
4.43% |
156.93 |
|
| Well-Off Workers, Family Areas |
4.98% |
7.27% |
68.45 |
|
| Affluent Urbanites, Town & City Areas |
5.36% |
2.56% |
208.95 |
|
| Prosperous Professionals, Metropolitan Areas |
1.07% |
2.04% |
52.21 |
|
| Better-Off Executives, Inner City Areas |
4.11% |
3.94% |
104.13 |
|
| Comfortable Middle Agers, Mature Home Owning Areas |
6.52% |
13.04% |
49.97 |
|
| Skilled Workers, Home Owning Areas |
9.23% |
12.70% |
72.66 |
|
| New Home Owners, Mature Communities |
7.53% |
8.14% |
92.43 |
|
| White Collar Workers, Better-Off Multi Ethnic Areas |
9.25% |
4.02% |
230.00 |
|
| Older People, Less Prosperous Areas |
4.76% |
3.19% |
149.56 |
|
| Council Estate Residents, Better-Off Homes |
19.21% |
11.31% |
169.80 |
|
| Council Estate Residents, High Unemployment |
1.90% |
3.06% |
62.03 |
|
| Council Estate Residents, Greatest Hardship |
6.67% |
2.52% |
264.95 |
|
| People in Multi-Ethnic, Low-Income Areas |
1.78% |
2.10% |
84.62 |
|
| Unclassified |
0.00% |
0.06% |
0.00 |
|
|
 |
 |
 |
| £0-5K |
11.83% |
9.41% |
125.68 |
|
| £5-10K |
18.95% |
16.63% |
113.96 |
|
| £10-15K |
17.36% |
16.58% |
104.72 |
|
| £15-20K |
13.34% |
13.58% |
98.21 |
|
| £20-25K |
9.74% |
10.39% |
93.69 |
|
| £25-30K |
7.04% |
7.77% |
90.51 |
|
| £30-35K |
5.11% |
5.79% |
88.23 |
|
| £35-40K |
3.75% |
4.33% |
86.55 |
|
| £40-45K |
2.78% |
3.27% |
85.28 |
|
| £45-50K |
2.09% |
2.48% |
84.29 |
|
| £50-55K |
1.59% |
1.90% |
83.49 |
|
| £55-60K |
1.22% |
1.47% |
82.84 |
|
| £60-65K |
0.95% |
1.15% |
82.28 |
|
| £65-70K |
0.74% |
0.91% |
81.80 |
|
| £70-75K |
0.59% |
0.72% |
81.36 |
|
| £75-80K |
0.47% |
0.57% |
80.97 |
|
| £80-85K |
0.37% |
0.46% |
80.60 |
|
| £85-90K |
0.30% |
0.37% |
80.25 |
|
| £90-95K |
0.24% |
0.31% |
79.92 |
|
| £95-100K |
0.20% |
0.25% |
79.59 |
|
| £100K + |
1.04% |
1.34% |
77.41 |
|
|
|

|


|
1992-1997
|
1997-2001
|
|
|
|
| Con |
-11.38% |
| Lab |
7.12% |
| LD |
-0.06% |
| PC |
2.24% |
|
| Con |
-0.18% |
| Lab |
-5.77% |
| LD |
2.24% |
| PC |
4.83% |
|
|
 |
Kevin Brennan
Labour hold
|
| Con |
 |
7,273 |
21.34% |
| Lab |
 |
18,594 |
54.56% |
| LD |
 |
4,458 |
13.08% |
| PC |
 |
3,296 |
9.67% |
| Oth |
 |
462 |
1.36% |
| Maj |
 |
11,321 |
33.22% |
| Turn |
 |
34,083 |
58.41% |
|
|
 |
Kevin Brennan
Labour hold
|
| PC |
Delme Bowen |
3,296 |
9.67% |
| L |
Kevin Brennan |
18,594 |
54.56% |
| C |
Andrew Davies |
7,273 |
21.34% |
| LD |
Jacqui Gasson |
4,458 |
13.08% |
| UK |
Joyce Jenking |
462 |
1.36% |
|
Candidates representing 5 parties stood for election to this seat.
|
|
 |
Rhodri Morgan
Labour
|
| Con |
 |
8,669 |
21.52% |
| Lab |
 |
24,297 |
60.32% |
| LD |
 |
4,366 |
10.84% |
| PC |
 |
1,949 |
4.84% |
| Ref |
 |
996 |
2.47% |
| Oth |
|
0 |
0.00% |
| Maj |
 |
15,628 |
38.80% |
| Turn |
 |
40,277 |
69.21% |
|
|
 |
|
Labour
|
| Con |
 |
15,028 |
32.90% |
| Lab |
 |
24,319 |
53.20% |
| LD |
 |
5,005 |
10.90% |
| PC |
 |
1,178 |
2.60% |
| Oth |
 |
184 |
0.40% |
| Maj |
 |
9,291 |
20.30% |
| Turn |
 |
45,714 |
76.87% |
|
|
 |
|

|

