|
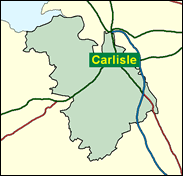
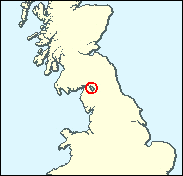
Carlisle
Labour hold

An independently minded and unusual town, once the home of the only nationalised pubs in the country as well as a medieval bishopric (one of only four such in the north), Carlisle has elected Labour MPs ever since 1964, firstly the teetotal Ron Lewis and then Eric Martlew. Margins have never been high, and the Conservatives have never lost all hope; in the 1980s, the majority never reached even one thousand. Also, they have over the years hoped for boundary changes which would bring in more of the solidly Tory border country to boost the often undersized Carlisle electorate. This may happen after the next review, but that is not due until after the next two general elections. There were persistent rumours that Eric Martlew would not fight Carlisle again for Labour, but he has indeed been reselected and is set for a fourth term in his home town seat.

Eric Martlew, elected here in 1987 and a Labour Whip in Opposition, was dropped in 1997, but made a PPS, at first to David Clark and then to Baroness Jay after Clark was sacked in 1998. A burly man, he comes with solid local credentials. Born 1949, educated locally at Harroby Secondary School and at technical college, he worked as a lab technician and then personnel manager at the local Nestle's factory for 21 years, sat on the local County Council for 14 years, and was Chairman of Carlisle Labour Party for six years. Reasonably enough a campaigner for an upgraded West Coast Main Line, he served as a rather plodding Defence spokesman in Opposition, under the equally lacklustre and hapless David Clark. He has been critical of the handling of the foot and mouth crisis.

 |
| Wealthy Achievers, Suburban Areas |
7.24% |
14.99% |
48.29 |
|
| Affluent Greys, Rural Communities |
1.20% |
2.13% |
56.47 |
|
| Prosperous Pensioners, Retirement Areas |
1.01% |
2.49% |
40.61 |
|
| Affluent Executives, Family Areas |
2.73% |
4.43% |
61.63 |
|
| Well-Off Workers, Family Areas |
8.43% |
7.27% |
115.86 |
|
| Affluent Urbanites, Town & City Areas |
1.41% |
2.56% |
54.97 |
|
| Prosperous Professionals, Metropolitan Areas |
0.00% |
2.04% |
0.00 |
|
| Better-Off Executives, Inner City Areas |
1.78% |
3.94% |
45.09 |
|
| Comfortable Middle Agers, Mature Home Owning Areas |
9.14% |
13.04% |
70.12 |
|
| Skilled Workers, Home Owning Areas |
27.46% |
12.70% |
216.20 |
|
| New Home Owners, Mature Communities |
10.34% |
8.14% |
126.95 |
|
| White Collar Workers, Better-Off Multi Ethnic Areas |
3.68% |
4.02% |
91.61 |
|
| Older People, Less Prosperous Areas |
6.19% |
3.19% |
194.32 |
|
| Council Estate Residents, Better-Off Homes |
14.30% |
11.31% |
126.38 |
|
| Council Estate Residents, High Unemployment |
0.37% |
3.06% |
12.11 |
|
| Council Estate Residents, Greatest Hardship |
4.62% |
2.52% |
183.32 |
|
| People in Multi-Ethnic, Low-Income Areas |
0.00% |
2.10% |
0.00 |
|
| Unclassified |
0.11% |
0.06% |
168.74 |
|
|
 |
|
|
| £0-5K |
10.08% |
9.41% |
107.06 |
|
| £5-10K |
20.58% |
16.63% |
123.74 |
|
| £10-15K |
20.33% |
16.58% |
122.62 |
|
| £15-20K |
15.51% |
13.58% |
114.20 |
|
| £20-25K |
10.73% |
10.39% |
103.28 |
|
| £25-30K |
7.17% |
7.77% |
92.19 |
|
| £30-35K |
4.75% |
5.79% |
81.96 |
|
| £35-40K |
3.16% |
4.33% |
72.94 |
|
| £40-45K |
2.13% |
3.27% |
65.15 |
|
| £45-50K |
1.45% |
2.48% |
58.50 |
|
| £50-55K |
1.01% |
1.90% |
52.85 |
|
| £55-60K |
0.71% |
1.47% |
48.03 |
|
| £60-65K |
0.51% |
1.15% |
43.92 |
|
| £65-70K |
0.37% |
0.91% |
40.39 |
|
| £70-75K |
0.27% |
0.72% |
37.35 |
|
| £75-80K |
0.20% |
0.57% |
34.71 |
|
| £80-85K |
0.15% |
0.46% |
32.40 |
|
| £85-90K |
0.11% |
0.37% |
30.38 |
|
| £90-95K |
0.09% |
0.31% |
28.60 |
|
| £95-100K |
0.07% |
0.25% |
27.01 |
|
| £100K + |
0.28% |
1.34% |
20.55 |
|
|
|
|


|
1992-1997
|
1997-2001
|
|
|
|
| Con |
-12.21% |
| Lab |
12.10% |
| LD |
-2.51% |
|
| Con |
5.83% |
| Lab |
-6.25% |
| LD |
1.18% |
|
|
|
Eric Martlew
Labour hold
|
| Con |
 |
12,154 |
34.82% |
| Lab |
 |
17,856 |
51.15% |
| LD |
 |
4,076 |
11.68% |
| Oth |
 |
823 |
2.36% |
| Maj |
 |
5,702 |
16.33% |
| Turn |
|
34,909 |
59.36% |
|
|
|
Eric Martlew
Labour hold
|
| LD |
John Guest |
4,076 |
11.68% |
| L |
Eric Martlew |
17,856 |
51.15% |
| C |
Mike Mitchelson |
12,154 |
34.82% |
| LCA |
Colin Paisley |
554 |
1.59% |
| SA |
Paul Wilcox |
269 |
0.77% |
|
Candidates representing 5 parties stood for election to this seat.
|
|
|
Eric Martlew
Labour
|
| Con |
|
12,641 |
28.99% |
| Lab |
|
25,031 |
57.40% |
| LD |
|
4,576 |
10.49% |
| Ref |
 |
1,233 |
2.83% |
| Oth |
|
126 |
0.29% |
| Maj |
|
12,390 |
28.41% |
| Turn |
|
43,607 |
72.78% |
|
|
|
|
Labour
|
| Con |
|
19,746 |
41.20% |
| Lab |
|
21,667 |
45.30% |
| LD |
|
6,232 |
13.00% |
| Oth |
|
230 |
0.50% |
| Maj |
|
1,921 |
4.00% |
| Turn |
|
47,875 |
78.33% |
|
|
|
|
|