|
Carmarthen East & Dinefwr
Plaid Cymru gain

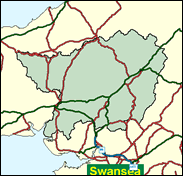
The hot tip for a Labour loss in Celtic Cymru lies here in this Carmarthen East seat. The Welsh Nationalists very much hope and expect to pick up a fifth MP. In May 1999 Plaid Cymru beat Labour by no fewer than 6,980 votes in the Welsh Assembly contest. The next month, Plaid Cymru polled the most votes again, in the far less parochial (or rather national) European elections. It is a seat where two-thirds of the population can speak the Welsh language and its gain would neatly complete the full hand of majority Welsh-speaking seats.

Labour's Alan Williams, a tiny, piping ex-science lecturer, elected here in 1987, born 1945 and educated at Carmarthen Grammar School and Jesus College Oxford, is distinguished from his Swansea namesake by his stature, voice and doctorate. Though a Welsh speaker in a majority Welsh-speaking seat, he has taken on the cultural fascism of nationalists who want to impose Welsh-only teaching in schools. His likely nemesis comes in the shape of Plaid Cymru's Adam Price, a miner's son Carmarthen born in 1968, educated at Dyffryn Amman School and Cardiff and Saarland Universities, director of an economic development consultancy and active campaigner for EU Objective funding for West Wales. The only majority Welsh-speaking seat not to be held by the nationalists currently, he should be a shoe-in.

 |
| Wealthy Achievers, Suburban Areas |
9.85% |
14.99% |
65.72 |
|
| Affluent Greys, Rural Communities |
30.30% |
2.13% |
1,425.18 |
|
| Prosperous Pensioners, Retirement Areas |
0.51% |
2.49% |
20.42 |
|
| Affluent Executives, Family Areas |
0.00% |
4.43% |
0.00 |
|
| Well-Off Workers, Family Areas |
0.00% |
7.27% |
0.00 |
|
| Affluent Urbanites, Town & City Areas |
0.05% |
2.56% |
1.78 |
|
| Prosperous Professionals, Metropolitan Areas |
0.00% |
2.04% |
0.00 |
|
| Better-Off Executives, Inner City Areas |
0.02% |
3.94% |
0.58 |
|
| Comfortable Middle Agers, Mature Home Owning Areas |
28.67% |
13.04% |
219.89 |
|
| Skilled Workers, Home Owning Areas |
4.82% |
12.70% |
37.98 |
|
| New Home Owners, Mature Communities |
20.53% |
8.14% |
252.09 |
|
| White Collar Workers, Better-Off Multi Ethnic Areas |
2.21% |
4.02% |
55.00 |
|
| Older People, Less Prosperous Areas |
0.90% |
3.19% |
28.28 |
|
| Council Estate Residents, Better-Off Homes |
2.13% |
11.31% |
18.82 |
|
| Council Estate Residents, High Unemployment |
0.00% |
3.06% |
0.00 |
|
| Council Estate Residents, Greatest Hardship |
0.00% |
2.52% |
0.00 |
|
| People in Multi-Ethnic, Low-Income Areas |
0.00% |
2.10% |
0.00 |
|
| Unclassified |
0.00% |
0.06% |
0.00 |
|
|
 |
 |
 |
| £0-5K |
11.23% |
9.41% |
119.34 |
|
| £5-10K |
19.31% |
16.63% |
116.09 |
|
| £10-15K |
18.50% |
16.58% |
111.59 |
|
| £15-20K |
14.43% |
13.58% |
106.22 |
|
| £20-25K |
10.44% |
10.39% |
100.46 |
|
| £25-30K |
7.36% |
7.77% |
94.67 |
|
| £30-35K |
5.16% |
5.79% |
89.08 |
|
| £35-40K |
3.63% |
4.33% |
83.80 |
|
| £40-45K |
2.58% |
3.27% |
78.88 |
|
| £45-50K |
1.85% |
2.48% |
74.33 |
|
| £50-55K |
1.34% |
1.90% |
70.16 |
|
| £55-60K |
0.98% |
1.47% |
66.33 |
|
| £60-65K |
0.72% |
1.15% |
62.83 |
|
| £65-70K |
0.54% |
0.91% |
59.62 |
|
| £70-75K |
0.41% |
0.72% |
56.67 |
|
| £75-80K |
0.31% |
0.57% |
53.96 |
|
| £80-85K |
0.24% |
0.46% |
51.48 |
|
| £85-90K |
0.18% |
0.37% |
49.18 |
|
| £90-95K |
0.14% |
0.31% |
47.06 |
|
| £95-100K |
0.11% |
0.25% |
45.10 |
|
| £100K + |
0.48% |
1.34% |
35.78 |
|
|
|

|


|
1992-1997
|
1997-2001
|
|
|
|
| Con |
-8.27% |
| Lab |
1.41% |
| LD |
-1.55% |
| PC |
5.54% |
|
| Con |
0.87% |
| Lab |
-7.33% |
| LD |
-0.15% |
| PC |
7.75% |
|
|
 |
Adam Price
Plaid Cymru gain
|
| Con |
 |
4,912 |
12.91% |
| Lab |
 |
13,540 |
35.58% |
| LD |
 |
2,815 |
7.40% |
| PC |
 |
16,130 |
42.39% |
| Oth |
 |
656 |
1.72% |
| Maj |
 |
2,590 |
6.81% |
| Turn |
 |
38,053 |
70.42% |
|
|
 |
Adam Price
Plaid Cymru gain
|
| LD |
Doiran Evans |
2,815 |
7.40% |
| PC |
Adam Price |
16,130 |
42.39% |
| UK |
Mike Squires |
656 |
1.72% |
| C |
David Thomas |
4,912 |
12.91% |
| L |
Alan Williams |
13,540 |
35.58% |
|
Candidates representing 5 parties stood for election to this seat.
|
|
 |
Alan Wynne Williams
Labour
|
| Con |
 |
5,022 |
12.03% |
| Lab |
 |
17,907 |
42.91% |
| LD |
 |
3,150 |
7.55% |
| PC |
 |
14,457 |
34.64% |
| Ref |
 |
1,196 |
2.87% |
| Oth |
|
0 |
0.00% |
| Maj |
 |
3,450 |
8.27% |
| Turn |
 |
41,732 |
78.62% |
|
|
 |
|
Labour
|
| Con |
 |
8,953 |
20.30% |
| Lab |
 |
18,305 |
41.50% |
| LD |
 |
4,023 |
9.10% |
| PC |
 |
12,815 |
29.10% |
| Oth |
|
0 |
0.00% |
| Maj |
 |
5,490 |
12.50% |
| Turn |
 |
44,096 |
78.62% |
|
|
 |
|

|

