|
Carmarthen West & South Pembrokeshire
Labour hold

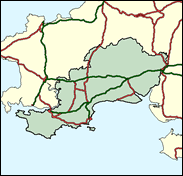
As one moves towards "Little England beyond Wales", as Pembrokeshire is known, the Nationalist threat is not nearly so strong as in Carmarthen East and Dinefwr, and nor do the Conservatives do not seem yet to have recovered sufficiently to pose a major threat to Labour's Nick Ainger. Nor do they do well in the section around Carmarthen town itself, which is included in this seat, along with Dylan Thomas's village of Laugharne, Welsh speaking but largely dominated by tourism. Overall the seat is a mixture of light industry, agriculture and tourist, English tone and Welsh tone, and conflicting political traditions of which at present Labour's is the strongest.

Becoming the first Labour MP here for 26 years in 1992, tall, bald and bearded, Nick Ainger cuts a dash as another English import into Wales. Born in Sheffield in 1947 and educated at Netherthorpe Grammar School, Staveley, Derbyshire, he moved to Milford Haven in the 1970s as a marine rigger. His careful nursing of constituency interests such as oil tanker safety, local military installations and threats to fishing and farming, has since 1997 been accompanied by his job as PPS to Welsh Secretaries, originally to the benighted Ron Davies, and currently to Paul Murphy.

 |
| Wealthy Achievers, Suburban Areas |
13.11% |
14.99% |
87.43 |
|
| Affluent Greys, Rural Communities |
24.73% |
2.13% |
1,162.95 |
|
| Prosperous Pensioners, Retirement Areas |
5.71% |
2.49% |
229.70 |
|
| Affluent Executives, Family Areas |
0.15% |
4.43% |
3.34 |
|
| Well-Off Workers, Family Areas |
1.29% |
7.27% |
17.75 |
|
| Affluent Urbanites, Town & City Areas |
0.09% |
2.56% |
3.52 |
|
| Prosperous Professionals, Metropolitan Areas |
0.00% |
2.04% |
0.00 |
|
| Better-Off Executives, Inner City Areas |
1.22% |
3.94% |
30.92 |
|
| Comfortable Middle Agers, Mature Home Owning Areas |
20.14% |
13.04% |
154.43 |
|
| Skilled Workers, Home Owning Areas |
5.62% |
12.70% |
44.22 |
|
| New Home Owners, Mature Communities |
11.14% |
8.14% |
136.78 |
|
| White Collar Workers, Better-Off Multi Ethnic Areas |
7.85% |
4.02% |
195.24 |
|
| Older People, Less Prosperous Areas |
0.72% |
3.19% |
22.57 |
|
| Council Estate Residents, Better-Off Homes |
5.82% |
11.31% |
51.44 |
|
| Council Estate Residents, High Unemployment |
0.00% |
3.06% |
0.00 |
|
| Council Estate Residents, Greatest Hardship |
2.11% |
2.52% |
83.79 |
|
| People in Multi-Ethnic, Low-Income Areas |
0.00% |
2.10% |
0.00 |
|
| Unclassified |
0.31% |
0.06% |
502.00 |
|
|
 |
 |
 |
| £0-5K |
11.20% |
9.41% |
118.96 |
|
| £5-10K |
20.15% |
16.63% |
121.18 |
|
| £10-15K |
19.06% |
16.58% |
114.93 |
|
| £15-20K |
14.53% |
13.58% |
106.95 |
|
| £20-25K |
10.29% |
10.39% |
99.02 |
|
| £25-30K |
7.13% |
7.77% |
91.68 |
|
| £30-35K |
4.93% |
5.79% |
85.05 |
|
| £35-40K |
3.43% |
4.33% |
79.12 |
|
| £40-45K |
2.41% |
3.27% |
73.82 |
|
| £45-50K |
1.71% |
2.48% |
69.08 |
|
| £50-55K |
1.23% |
1.90% |
64.84 |
|
| £55-60K |
0.90% |
1.47% |
61.02 |
|
| £60-65K |
0.66% |
1.15% |
57.57 |
|
| £65-70K |
0.49% |
0.91% |
54.44 |
|
| £70-75K |
0.37% |
0.72% |
51.60 |
|
| £75-80K |
0.28% |
0.57% |
49.00 |
|
| £80-85K |
0.22% |
0.46% |
46.63 |
|
| £85-90K |
0.17% |
0.37% |
44.44 |
|
| £90-95K |
0.13% |
0.31% |
42.43 |
|
| £95-100K |
0.10% |
0.25% |
40.57 |
|
| £100K + |
0.43% |
1.34% |
31.70 |
|
|
|

|


|
1992-1997
|
1997-2001
|
|
|
|
| Con |
-8.92% |
| Lab |
10.65% |
| LD |
-2.65% |
| PC |
-2.43% |
|
| Con |
2.70% |
| Lab |
-7.57% |
| LD |
0.55% |
| PC |
6.00% |
|
|
 |
Nick Ainger
Labour hold
|
| Con |
 |
10,811 |
29.29% |
| Lab |
 |
15,349 |
41.58% |
| LD |
 |
3,248 |
8.80% |
| PC |
 |
6,893 |
18.67% |
| Oth |
 |
615 |
1.67% |
| Maj |
 |
4,538 |
12.29% |
| Turn |
 |
36,916 |
65.32% |
|
|
 |
Nick Ainger
Labour hold
|
| L |
Nick Ainger |
15,349 |
41.58% |
| PC |
Llyr Hughes Griffiths |
6,893 |
18.67% |
| LD |
William Jeremy |
3,248 |
8.80% |
| UK |
Ian Phillips |
537 |
1.45% |
| Cus |
Nick Turner |
78 |
0.21% |
| C |
Robert Wilson |
10,811 |
29.29% |
|
Candidates representing 6 parties stood for election to this seat.
|
|
 |
Nicholas Ainger
Labour
|
| Con |
 |
11,335 |
26.58% |
| Lab |
 |
20,956 |
49.15% |
| LD |
 |
3,516 |
8.25% |
| PC |
 |
5,402 |
12.67% |
| Ref |
 |
1,432 |
3.36% |
| Oth |
|
0 |
0.00% |
| Maj |
 |
9,621 |
22.56% |
| Turn |
 |
42,641 |
76.52% |
|
|
 |
|
Labour
|
| Con |
 |
15,278 |
35.50% |
| Lab |
 |
16,588 |
38.50% |
| LD |
 |
4,672 |
10.90% |
| PC |
 |
6,497 |
15.10% |
| Oth |
|
0 |
0.00% |
| Maj |
 |
1,310 |
3.00% |
| Turn |
 |
43,035 |
77.69% |
|
|
 |
|

|

