|
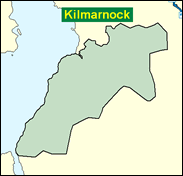
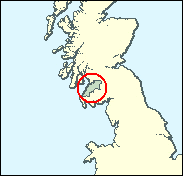
Carrick, Cumnock & Doon Valley
Labour hold

In the inaugural contests in May 1999 for the new Scottish Parliament Labour held this safe seat in what used to be called South Ayrshire by nearly 9,000 from the SNP on a turnout of 63pc, over 10pc less than the 1997 General Election. There is a minority Conservative vote centred on the coast, in such small resorts as Girvan, and in the farmland inland, but the seat is dominated by the stark ex-coalfield communities in the wild terrain of New Cumnock and Dalmellington, which seem if anything even more remote now than when they were at the heart of the South Ayrshire coalfield.

George Foulkes, a former minister stuck for 4 years at International Development with Clare Short, until moved to the Scottish Office in January 2001, was born in 1942, educated at Keith Grammar School, Haberdashers Askes, and Edinburgh University. Chubby and convivial, he was off the Opposition frontbench for a while in the early nineties after a drunken incident, and must wonder, as the clock ticks on, whether he will not after the election be joining the backbench queue for a peerage. Meanwhile his "proudest achievement is to have played a little part in the return of democracy to Chile".

 |
| Wealthy Achievers, Suburban Areas |
9.77% |
14.99% |
65.17 |
|
| Affluent Greys, Rural Communities |
2.93% |
2.13% |
137.78 |
|
| Prosperous Pensioners, Retirement Areas |
1.46% |
2.49% |
58.57 |
|
| Affluent Executives, Family Areas |
4.47% |
4.43% |
100.92 |
|
| Well-Off Workers, Family Areas |
5.78% |
7.27% |
79.40 |
|
| Affluent Urbanites, Town & City Areas |
0.30% |
2.56% |
11.80 |
|
| Prosperous Professionals, Metropolitan Areas |
0.03% |
2.04% |
1.25 |
|
| Better-Off Executives, Inner City Areas |
0.05% |
3.94% |
1.23 |
|
| Comfortable Middle Agers, Mature Home Owning Areas |
3.45% |
13.04% |
26.48 |
|
| Skilled Workers, Home Owning Areas |
6.08% |
12.70% |
47.86 |
|
| New Home Owners, Mature Communities |
10.97% |
8.14% |
134.68 |
|
| White Collar Workers, Better-Off Multi Ethnic Areas |
2.03% |
4.02% |
50.42 |
|
| Older People, Less Prosperous Areas |
6.79% |
3.19% |
213.15 |
|
| Council Estate Residents, Better-Off Homes |
30.96% |
11.31% |
273.74 |
|
| Council Estate Residents, High Unemployment |
3.37% |
3.06% |
110.18 |
|
| Council Estate Residents, Greatest Hardship |
11.54% |
2.52% |
458.25 |
|
| People in Multi-Ethnic, Low-Income Areas |
0.00% |
2.10% |
0.00 |
|
| Unclassified |
0.03% |
0.06% |
50.49 |
|
|
 |
 |
 |
| £0-5K |
11.58% |
9.41% |
123.05 |
|
| £5-10K |
20.65% |
16.63% |
124.18 |
|
| £10-15K |
18.96% |
16.58% |
114.38 |
|
| £15-20K |
14.06% |
13.58% |
103.53 |
|
| £20-25K |
9.80% |
10.39% |
94.31 |
|
| £25-30K |
6.77% |
7.77% |
87.07 |
|
| £30-35K |
4.72% |
5.79% |
81.49 |
|
| £35-40K |
3.34% |
4.33% |
77.16 |
|
| £40-45K |
2.41% |
3.27% |
73.75 |
|
| £45-50K |
1.76% |
2.48% |
70.99 |
|
| £50-55K |
1.31% |
1.90% |
68.68 |
|
| £55-60K |
0.98% |
1.47% |
66.70 |
|
| £60-65K |
0.75% |
1.15% |
64.95 |
|
| £65-70K |
0.57% |
0.91% |
63.37 |
|
| £70-75K |
0.45% |
0.72% |
61.92 |
|
| £75-80K |
0.35% |
0.57% |
60.56 |
|
| £80-85K |
0.27% |
0.46% |
59.29 |
|
| £85-90K |
0.22% |
0.37% |
58.08 |
|
| £90-95K |
0.17% |
0.31% |
56.93 |
|
| £95-100K |
0.14% |
0.25% |
55.82 |
|
| £100K + |
0.66% |
1.34% |
49.42 |
|
|
|

|


|
1992-1997
|
1997-2001
|
|
|
|
| Con |
-8.75% |
| Lab |
5.69% |
| LD |
0.11% |
| SNP |
1.56% |
|
| Con |
1.29% |
| Lab |
-4.50% |
| LD |
2.00% |
| SNP |
-1.05% |
|
|
 |
George Foulkes
Labour hold
|
| Con |
 |
7,318 |
18.25% |
| Lab |
 |
22,174 |
55.29% |
| LD |
 |
2,932 |
7.31% |
| SNP |
 |
6,258 |
15.60% |
| Oth |
 |
1,425 |
3.55% |
| Maj |
 |
14,856 |
37.04% |
| Turn |
 |
40,107 |
61.78% |
|
|
 |
George Foulkes
Labour hold
|
| LC |
George Foulkes |
22,174 |
55.29% |
| SL |
James McDaid |
367 |
0.92% |
| SSP |
Amanda McFarlane |
1,058 |
2.64% |
| C |
Gordon Miller |
7,318 |
18.25% |
| LD |
Amy Rogers |
2,932 |
7.31% |
| SNP |
Tom Wilson |
6,258 |
15.60% |
|
Candidates representing 6 parties stood for election to this seat.
|
|
 |
George Foulkes
Labour
|
| Con |
 |
8,336 |
16.95% |
| Lab |
 |
29,398 |
59.79% |
| LD |
 |
2,613 |
5.31% |
| SNP |
 |
8,190 |
16.66% |
| Ref |
 |
634 |
1.29% |
| Oth |
|
0 |
0.00% |
| Maj |
 |
21,062 |
42.83% |
| Turn |
 |
49,171 |
74.96% |
|
|
 |
|
Labour
|
| Con |
 |
13,271 |
25.70% |
| Lab |
 |
27,957 |
54.10% |
| LD |
 |
2,690 |
5.20% |
| SNP |
 |
7,802 |
15.10% |
| Oth |
|
0 |
0.00% |
| Maj |
 |
14,686 |
28.40% |
| Turn |
 |
51,720 |
77.19% |
|
|
 |
|

|

