|
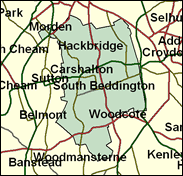
Carshalton & Wallington
Liberal Democrat hold

Although it must rank as a top Tory target seat in the south west London band of five which were taken from them by the Liberal Democrats in 1997, it would be unwise to write off Tom Brake's chances of winning a second term. This is because of three main reasons: the ability of so many Liberal MPs to build up a personal and to some extent independent vote based on hard work and local service; the continued dominance of Sutton Borough politics by the Liberal Democrats; and the reluctance of Conservative voters to return to the fold, as evidenced by midterm elections and opinion polls alike (in December 2000 an Evening Standard poll suggested no significant overall movement in London between the three main parties since the 1997 General Election). There is a significant working class bloc in the old London County Council overspill estate of St Helier, which must provide a substantial part of Labour's 24pc share in 1997. This could be a profitable source of tactical voting to enable Tom Brake to hold on against a Tory revival.

Tom Brake, a young (born 1962) computer software consultant, educated at the Lycee International in Paris and Imperial College London, won here for the Liberal Democrats in 1997. Tall, lean, an Environment spokesman and Whip, he has the easy job of complaining about awful rail services and road congestion on behalf of his suburban audience. A former local (Sutton) councillor who fought the seat in 1992 before winning in 1997, his local roots are effective as he confronts his potential nemesis in the shape of Tory, Dr. Ken Andrew. Born 1944, and educated at Downhills School, Enfield College and the Universities of Wales and London, he is a former marketing director with Nat West and Chase Manhattan and a commercial director with the National and Provincial Building Society, and currently joint owner of Serviced Office Company and a non-executive director of Sherwood International. He presents himself as a response to the Conservative Party's call for successful businessmen to pursue a parliamentary career, but in his case at the age of 56.

 |
| Wealthy Achievers, Suburban Areas |
23.54% |
14.99% |
157.01 |
|
| Affluent Greys, Rural Communities |
0.05% |
2.13% |
2.14 |
|
| Prosperous Pensioners, Retirement Areas |
1.31% |
2.49% |
52.73 |
|
| Affluent Executives, Family Areas |
0.18% |
4.43% |
3.98 |
|
| Well-Off Workers, Family Areas |
5.03% |
7.27% |
69.13 |
|
| Affluent Urbanites, Town & City Areas |
10.19% |
2.56% |
397.30 |
|
| Prosperous Professionals, Metropolitan Areas |
1.89% |
2.04% |
92.62 |
|
| Better-Off Executives, Inner City Areas |
1.04% |
3.94% |
26.39 |
|
| Comfortable Middle Agers, Mature Home Owning Areas |
14.40% |
13.04% |
110.43 |
|
| Skilled Workers, Home Owning Areas |
13.86% |
12.70% |
109.09 |
|
| New Home Owners, Mature Communities |
3.81% |
8.14% |
46.78 |
|
| White Collar Workers, Better-Off Multi Ethnic Areas |
0.75% |
4.02% |
18.55 |
|
| Older People, Less Prosperous Areas |
2.98% |
3.19% |
93.48 |
|
| Council Estate Residents, Better-Off Homes |
17.34% |
11.31% |
153.33 |
|
| Council Estate Residents, High Unemployment |
2.56% |
3.06% |
83.58 |
|
| Council Estate Residents, Greatest Hardship |
0.99% |
2.52% |
39.17 |
|
| People in Multi-Ethnic, Low-Income Areas |
0.00% |
2.10% |
0.00 |
|
| Unclassified |
0.10% |
0.06% |
156.39 |
|
|
 |
 |
 |
| £0-5K |
6.28% |
9.41% |
66.66 |
|
| £5-10K |
12.29% |
16.63% |
73.87 |
|
| £10-15K |
13.94% |
16.58% |
84.10 |
|
| £15-20K |
12.85% |
13.58% |
94.62 |
|
| £20-25K |
10.86% |
10.39% |
104.49 |
|
| £25-30K |
8.81% |
7.77% |
113.35 |
|
| £30-35K |
7.01% |
5.79% |
121.11 |
|
| £35-40K |
5.54% |
4.33% |
127.79 |
|
| £40-45K |
4.36% |
3.27% |
133.46 |
|
| £45-50K |
3.43% |
2.48% |
138.22 |
|
| £50-55K |
2.71% |
1.90% |
142.18 |
|
| £55-60K |
2.14% |
1.47% |
145.44 |
|
| £60-65K |
1.71% |
1.15% |
148.10 |
|
| £65-70K |
1.36% |
0.91% |
150.22 |
|
| £70-75K |
1.09% |
0.72% |
151.89 |
|
| £75-80K |
0.88% |
0.57% |
153.17 |
|
| £80-85K |
0.71% |
0.46% |
154.11 |
|
| £85-90K |
0.58% |
0.37% |
154.76 |
|
| £90-95K |
0.47% |
0.31% |
155.16 |
|
| £95-100K |
0.39% |
0.25% |
155.35 |
|
| £100K + |
2.03% |
1.34% |
151.24 |
|
|
|

|


|
1992-1997
|
1997-2001
|
|
|
|
| Con |
-16.20% |
| Lab |
6.18% |
| LD |
7.28% |
|
| Con |
0.33% |
| Lab |
-5.50% |
| LD |
6.85% |
|
|
 |
Thomas Brake
Liberal Democrat hold
|
| Con |
 |
13,742 |
33.84% |
| Lab |
 |
7,466 |
18.38% |
| LD |
 |
18,289 |
45.03% |
| Oth |
 |
1,115 |
2.75% |
| Maj |
 |
4,547 |
11.20% |
| Turn |
 |
40,612 |
60.31% |
|
|
 |
Thomas Brake
Liberal Democrat hold
|
| C |
Ken Andrew |
13,742 |
33.84% |
| LD |
Thomas Brake |
18,289 |
45.03% |
| L |
Margaret Cooper |
7,466 |
18.38% |
| G |
Simon Dixon |
614 |
1.51% |
| UK |
Martin Haley |
501 |
1.23% |
|
Candidates representing 5 parties stood for election to this seat.
|
|
 |
Thomas Brake
Liberal Democrat gain
|
| Con |
 |
16,223 |
33.50% |
| Lab |
 |
11,565 |
23.88% |
| LD |
 |
18,490 |
38.18% |
| Ref |
 |
1,289 |
2.66% |
| Oth |
 |
856 |
1.77% |
| Maj |
 |
2,267 |
4.68% |
| Turn |
 |
48,423 |
73.33% |
|
|
 |
|
Conservative
|
| Con |
 |
26,243 |
49.70% |
| Lab |
 |
9,333 |
17.70% |
| LD |
 |
16,300 |
30.90% |
| Oth |
 |
880 |
1.70% |
| Maj |
 |
9,943 |
18.80% |
| Turn |
 |
52,756 |
80.93% |
|
|
 |
|

|

