|
Castle Point
Conservative gain

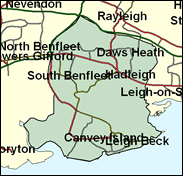
Castle Point consists of the town of Benfleet plus Canvey Island in south east Essex. Although scarcely a glamorous corner of Britain, over 89pc of the housing is owner-occupied, the nation's second highest figure, and the 1992 result saw a Conservative victory by 16,830 votes. It might seem that this apparently very unlikely Labour gain of 1997 ( by 1,143 votes on a swing of no less than 17 per cent) must surely be reversed at the next General Election. But in the May 1999 local elections, Labour won 25 council seats to the Tories' 14 in the Castle Point District, which exactly matches the parliamentary constituency, and took 53.3pc of the total vote to the Conservatives' 45.9pc (there were only three other candidates in any of the District's wards in this straight-fight area). If Christine Butler does lose the re-run to Robert Spink, it should be very closely.

Christine Butler, Labour's 4th least expected new MP in 1997, in what was supposedly the Tories' 77th safest seat, was a local Essex county councillor before her election. Born 1943, educated at grammar schools and at Middlesex Polytechnic, she was a research assistant in the pharmaceutical industry and in the NHS. In her first year she tabled four written questions. Her Tory challenger is the man she beat in 1997, Dr Robert Spink, a Yorkshire-born (1948) former mill boy and electronics apprentice who eventually acquired a Manchester University doctorate in management economics. An engineer with EMI for 11 years who became a management consultant, eventually running Bournemouth Airport, he won the seat in 1992 and established a reputation as a keen privatiser and deregulator, if conservative on Sunday trading. Opposed to joining the euro "even if economically beneficial", he was Ann Widdecombe's PPS for three years, is anti-abortion and has been the subject of a 50-strong local Tory petition to have him deselected.

 |
| Wealthy Achievers, Suburban Areas |
35.01% |
14.99% |
233.52 |
|
| Affluent Greys, Rural Communities |
0.09% |
2.13% |
4.09 |
|
| Prosperous Pensioners, Retirement Areas |
2.79% |
2.49% |
112.35 |
|
| Affluent Executives, Family Areas |
4.09% |
4.43% |
92.37 |
|
| Well-Off Workers, Family Areas |
14.61% |
7.27% |
200.85 |
|
| Affluent Urbanites, Town & City Areas |
0.05% |
2.56% |
2.14 |
|
| Prosperous Professionals, Metropolitan Areas |
0.00% |
2.04% |
0.00 |
|
| Better-Off Executives, Inner City Areas |
0.00% |
3.94% |
0.00 |
|
| Comfortable Middle Agers, Mature Home Owning Areas |
32.17% |
13.04% |
246.69 |
|
| Skilled Workers, Home Owning Areas |
2.44% |
12.70% |
19.18 |
|
| New Home Owners, Mature Communities |
2.87% |
8.14% |
35.22 |
|
| White Collar Workers, Better-Off Multi Ethnic Areas |
0.00% |
4.02% |
0.00 |
|
| Older People, Less Prosperous Areas |
0.03% |
3.19% |
0.93 |
|
| Council Estate Residents, Better-Off Homes |
5.74% |
11.31% |
50.78 |
|
| Council Estate Residents, High Unemployment |
0.11% |
3.06% |
3.65 |
|
| Council Estate Residents, Greatest Hardship |
0.00% |
2.52% |
0.00 |
|
| People in Multi-Ethnic, Low-Income Areas |
0.00% |
2.10% |
0.00 |
|
| Unclassified |
0.00% |
0.06% |
0.00 |
|
|
 |
 |
 |
| £0-5K |
7.34% |
9.41% |
77.99 |
|
| £5-10K |
13.47% |
16.63% |
81.01 |
|
| £10-15K |
14.70% |
16.58% |
88.64 |
|
| £15-20K |
13.12% |
13.58% |
96.61 |
|
| £20-25K |
10.80% |
10.39% |
103.89 |
|
| £25-30K |
8.57% |
7.77% |
110.21 |
|
| £30-35K |
6.69% |
5.79% |
115.58 |
|
| £35-40K |
5.20% |
4.33% |
120.09 |
|
| £40-45K |
4.04% |
3.27% |
123.85 |
|
| £45-50K |
3.15% |
2.48% |
126.98 |
|
| £50-55K |
2.47% |
1.90% |
129.58 |
|
| £55-60K |
1.94% |
1.47% |
131.73 |
|
| £60-65K |
1.54% |
1.15% |
133.50 |
|
| £65-70K |
1.22% |
0.91% |
134.96 |
|
| £70-75K |
0.98% |
0.72% |
136.15 |
|
| £75-80K |
0.79% |
0.57% |
137.12 |
|
| £80-85K |
0.64% |
0.46% |
137.91 |
|
| £85-90K |
0.52% |
0.37% |
138.53 |
|
| £90-95K |
0.42% |
0.31% |
139.02 |
|
| £95-100K |
0.35% |
0.25% |
139.39 |
|
| £100K + |
1.87% |
1.34% |
139.12 |
|
|
|

|


|
1992-1997
|
1997-2001
|
|
|
|
| Con |
-15.48% |
| Lab |
18.42% |
| LD |
-9.98% |
|
| Con |
4.49% |
| Lab |
-0.29% |
| LD |
-1.38% |
|
|
 |
Robert Spink
Conservative gain
|
| Con |
 |
17,738 |
44.61% |
| Lab |
 |
16,753 |
42.13% |
| LD |
 |
3,116 |
7.84% |
| Oth |
 |
2,156 |
5.42% |
| Maj |
 |
985 |
2.48% |
| Turn |
 |
39,763 |
58.38% |
|
|
 |
Robert Spink
Conservative gain
|
| LD |
Billy Boulton |
3,116 |
7.84% |
| L |
Christine Butler |
16,753 |
42.13% |
| UK |
Ron Hurrell |
1,273 |
3.20% |
| I |
Douglas Roberts |
663 |
1.67% |
| TH |
Nik Searle |
220 |
0.55% |
| C |
Robert Spink |
17,738 |
44.61% |
|
Candidates representing 6 parties stood for election to this seat.
|
|
 |
Christine Butler
Labour gain
|
| Con |
 |
19,489 |
40.12% |
| Lab |
 |
20,605 |
42.42% |
| LD |
 |
4,477 |
9.22% |
| Ref |
 |
2,700 |
5.56% |
| Oth |
 |
1,301 |
2.68% |
| Maj |
 |
1,116 |
2.30% |
| Turn |
 |
48,572 |
72.34% |
|
|
 |
|
Conservative
|
| Con |
 |
29,629 |
55.60% |
| Lab |
 |
12,799 |
24.00% |
| LD |
 |
10,208 |
19.20% |
| Oth |
 |
643 |
1.20% |
| Maj |
 |
16,830 |
31.60% |
| Turn |
 |
53,279 |
79.08% |
|
|
 |
|

|

