|
Ceredigion
Plaid Cymru hold

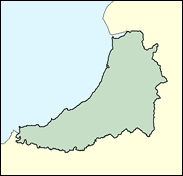
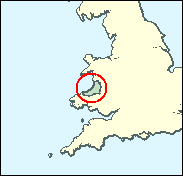
The Plaid Cymru MP Cynog Dafis resigned to create a by-election in Ceredigion, mid Wales (formerly Cardiganshire, but about six out of ten residents speak Welsh) on his election to the Welsh Assembly in 1999. This was unusual, as most Westminster MPs of all parties in his position simply announced their retirement at the next General Election; but his principles were rewarded when the seat was very comfortably held for the Nationalists, and it now looks safe after a long, predominantly Liberal, history for their new MP (with a slightly less Welsh-sounding name, Simon Thomas).

Simon Thomas retained this seat for Plaid Cymru at the 2000 byelection following retreat to the Welsh Assembly of the former Plaid MP Cynog Dafis, whose preoccupation with environmentalism he shares. The compete Welsh nationalist apparatchik, born 1964 and educated at Aberdare Boys' School and Aberystwyth University, he has worked for the party in some form for at least 8 years, latterly writing its election manifesto whilst doubling up as a 'community development officer' stimulating rural development through public-private-voluntary sector partnerships. Slim, with short, dark, retreating hair, he is the first male MP known to have worn studs in his ear. South Wales-accented, he learnt Welsh as a young adult, has a zealous air, and cycles.

 |
| Wealthy Achievers, Suburban Areas |
8.76% |
14.99% |
58.45 |
|
| Affluent Greys, Rural Communities |
44.61% |
2.13% |
2,098.09 |
|
| Prosperous Pensioners, Retirement Areas |
2.79% |
2.49% |
112.20 |
|
| Affluent Executives, Family Areas |
0.26% |
4.43% |
5.77 |
|
| Well-Off Workers, Family Areas |
0.88% |
7.27% |
12.06 |
|
| Affluent Urbanites, Town & City Areas |
4.93% |
2.56% |
192.11 |
|
| Prosperous Professionals, Metropolitan Areas |
0.00% |
2.04% |
0.00 |
|
| Better-Off Executives, Inner City Areas |
3.90% |
3.94% |
98.79 |
|
| Comfortable Middle Agers, Mature Home Owning Areas |
17.92% |
13.04% |
137.42 |
|
| Skilled Workers, Home Owning Areas |
0.25% |
12.70% |
1.97 |
|
| New Home Owners, Mature Communities |
7.09% |
8.14% |
87.12 |
|
| White Collar Workers, Better-Off Multi Ethnic Areas |
6.88% |
4.02% |
171.12 |
|
| Older People, Less Prosperous Areas |
0.26% |
3.19% |
8.19 |
|
| Council Estate Residents, Better-Off Homes |
0.78% |
11.31% |
6.92 |
|
| Council Estate Residents, High Unemployment |
0.00% |
3.06% |
0.00 |
|
| Council Estate Residents, Greatest Hardship |
0.69% |
2.52% |
27.47 |
|
| People in Multi-Ethnic, Low-Income Areas |
0.00% |
2.10% |
0.00 |
|
| Unclassified |
0.00% |
0.06% |
0.00 |
|
|
 |
 |
 |
| £0-5K |
10.82% |
9.41% |
114.93 |
|
| £5-10K |
19.96% |
16.63% |
120.02 |
|
| £10-15K |
19.30% |
16.58% |
116.44 |
|
| £15-20K |
14.90% |
13.58% |
109.70 |
|
| £20-25K |
10.59% |
10.39% |
101.90 |
|
| £25-30K |
7.31% |
7.77% |
93.99 |
|
| £30-35K |
5.01% |
5.79% |
86.44 |
|
| £35-40K |
3.44% |
4.33% |
79.44 |
|
| £40-45K |
2.39% |
3.27% |
73.07 |
|
| £45-50K |
1.67% |
2.48% |
67.31 |
|
| £50-55K |
1.18% |
1.90% |
62.13 |
|
| £55-60K |
0.85% |
1.47% |
57.49 |
|
| £60-65K |
0.61% |
1.15% |
53.33 |
|
| £65-70K |
0.45% |
0.91% |
49.60 |
|
| £70-75K |
0.33% |
0.72% |
46.25 |
|
| £75-80K |
0.25% |
0.57% |
43.24 |
|
| £80-85K |
0.19% |
0.46% |
40.52 |
|
| £85-90K |
0.14% |
0.37% |
38.07 |
|
| £90-95K |
0.11% |
0.31% |
35.84 |
|
| £95-100K |
0.08% |
0.25% |
33.82 |
|
| £100K + |
0.34% |
1.34% |
25.02 |
|
|
|

|


|
1992-1997
|
1997-2001
|
|
|
|
| Con |
-9.11% |
| Lab |
5.70% |
| LD |
-10.04% |
| PC |
10.63% |
|
| Con |
4.56% |
| Lab |
-8.88% |
| LD |
10.40% |
|
|
 |
Simon Thomas
Plaid Cymru hold
|
| Con |
 |
6,730 |
19.45% |
| Lab |
 |
5,338 |
15.43% |
| LD |
 |
9,297 |
26.87% |
| PC |
 |
13,241 |
38.26% |
| Oth |
|
0 |
0.00% |
| Maj |
 |
3,944 |
11.40% |
| Turn |
 |
34,606 |
61.67% |
|
|
 |
Simon Thomas
Plaid Cymru hold
|
| C |
Paul Davies |
6,730 |
19.45% |
| L |
David Grace |
5,338 |
15.43% |
| PC |
Simon Thomas |
13,241 |
38.26% |
| LD |
Mark Williams |
9,297 |
26.87% |
|
Candidates representing 4 parties stood for election to this seat.
|
|
 |
|
By Election (3 February 2000)
|
|
Resignation of Cynog Glyndwr Dafis 10 January 2000
|
Simon Thomas
Plaid Cymru
|
| Con |
 |
4,138 |
16.51% |
| Lab |
 |
3,612 |
14.41% |
| LD |
 |
5,768 |
23.01% |
| PC |
 |
10,716 |
42.75% |
| Oth |
 |
831 |
3.32% |
| Maj |
 |
4,948 |
19.74% |
| Turn |
 |
25,065 |
46.02% |
|
|
 |
Cynog Dafis
Plaid Cymru
|
| Con |
 |
5,983 |
14.89% |
| Lab |
 |
9,767 |
24.30% |
| LD |
 |
6,616 |
16.46% |
| PC |
 |
16,728 |
41.63% |
| Ref |
 |
1,092 |
2.72% |
| Oth |
|
0 |
0.00% |
| Maj |
 |
6,961 |
17.32% |
| Turn |
 |
40,186 |
73.90% |
|
|
 |
|
Plaid Cymru
|
| Con |
 |
10,178 |
24.00% |
| Lab |
 |
7,889 |
18.60% |
| LD |
 |
11,251 |
26.50% |
| PC |
 |
13,144 |
31.00% |
| Oth |
|
0 |
0.00% |
| Maj |
 |
1,893 |
4.50% |
| Turn |
 |
42,462 |
77.96% |
|
|
 |
|

|

