|
Charnwood
Conservative hold

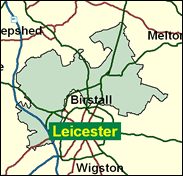
An extra seat was created by the Boundary Commission in Leicestershire in 1997, which swept up bits and pieces from five oversized Tory seats in the county. This was welcome news indeed for Stephen Dorrell, at one time a fast-rising Conservative Cabinet Minister. But in fact the boundary changes became a bane for the Tories because they corralled too many Tory voters in one seat at the expense of making all the others more vulnerable to Labour. Dorrell's former seat of Loughborough was a loss in 1997. Charnwood itself includes the almost all white (over 95pc), owner occupied (86pc, fourth highest in the UK) suburbs of Leicester, such as Birstall and the other comunities of the Soar Valley, and Leicester Forest East, known to many as a pit stop on the M1, and although it is not particularly upper class or well educated, it is almost an identikit Conservative near-certainty.

Stephen Dorrell moved here from vulnerable Loughborough in 1997, after serving in a series of government posts, eventually as Health Secretary. Born 1952, and Uppingham and Brasenose College Oxford-educated, he was and is again a director of his family's industrial clothing company. Appointed to run Health in a more voter-friendly way than Virginia Bottomley, as a One Nation Europhile he trimmed in a sceptical direction, but without helping his leadership prospects, and quit the frontbench after a year of Opposition in 1998. His career is politically only restorable under an unlikely comeback by Kenneth Clarke, whom he backed after dropping his own leadership bid in 1997.

 |
| Wealthy Achievers, Suburban Areas |
21.03% |
14.99% |
140.23 |
|
| Affluent Greys, Rural Communities |
0.16% |
2.13% |
7.66 |
|
| Prosperous Pensioners, Retirement Areas |
0.62% |
2.49% |
25.13 |
|
| Affluent Executives, Family Areas |
9.91% |
4.43% |
224.06 |
|
| Well-Off Workers, Family Areas |
22.65% |
7.27% |
311.43 |
|
| Affluent Urbanites, Town & City Areas |
0.09% |
2.56% |
3.55 |
|
| Prosperous Professionals, Metropolitan Areas |
0.00% |
2.04% |
0.00 |
|
| Better-Off Executives, Inner City Areas |
0.00% |
3.94% |
0.00 |
|
| Comfortable Middle Agers, Mature Home Owning Areas |
17.12% |
13.04% |
131.29 |
|
| Skilled Workers, Home Owning Areas |
18.42% |
12.70% |
145.04 |
|
| New Home Owners, Mature Communities |
6.48% |
8.14% |
79.58 |
|
| White Collar Workers, Better-Off Multi Ethnic Areas |
0.00% |
4.02% |
0.00 |
|
| Older People, Less Prosperous Areas |
2.92% |
3.19% |
91.71 |
|
| Council Estate Residents, Better-Off Homes |
0.43% |
11.31% |
3.76 |
|
| Council Estate Residents, High Unemployment |
0.13% |
3.06% |
4.28 |
|
| Council Estate Residents, Greatest Hardship |
0.00% |
2.52% |
0.00 |
|
| People in Multi-Ethnic, Low-Income Areas |
0.00% |
2.10% |
0.00 |
|
| Unclassified |
0.03% |
0.06% |
44.89 |
|
|
 |
 |
 |
| £0-5K |
6.99% |
9.41% |
74.26 |
|
| £5-10K |
14.51% |
16.63% |
87.23 |
|
| £10-15K |
16.21% |
16.58% |
97.75 |
|
| £15-20K |
14.27% |
13.58% |
105.05 |
|
| £20-25K |
11.39% |
10.39% |
109.55 |
|
| £25-30K |
8.71% |
7.77% |
111.99 |
|
| £30-35K |
6.55% |
5.79% |
113.01 |
|
| £35-40K |
4.90% |
4.33% |
113.07 |
|
| £40-45K |
3.67% |
3.27% |
112.50 |
|
| £45-50K |
2.77% |
2.48% |
111.55 |
|
| £50-55K |
2.10% |
1.90% |
110.35 |
|
| £55-60K |
1.61% |
1.47% |
109.01 |
|
| £60-65K |
1.24% |
1.15% |
107.59 |
|
| £65-70K |
0.96% |
0.91% |
106.15 |
|
| £70-75K |
0.75% |
0.72% |
104.70 |
|
| £75-80K |
0.59% |
0.57% |
103.27 |
|
| £80-85K |
0.47% |
0.46% |
101.88 |
|
| £85-90K |
0.38% |
0.37% |
100.52 |
|
| £90-95K |
0.30% |
0.31% |
99.20 |
|
| £95-100K |
0.24% |
0.25% |
97.93 |
|
| £100K + |
1.22% |
1.34% |
90.70 |
|
|
|

|


|
1992-1997
|
1997-2001
|
|
|
|
| Con |
-14.12% |
| Lab |
14.38% |
| LD |
-4.94% |
|
| Con |
1.75% |
| Lab |
-3.76% |
| LD |
3.37% |
|
|
 |
Stephen Dorrell
Conservative hold
|
| Con |
 |
23,283 |
48.23% |
| Lab |
 |
15,554 |
32.22% |
| LD |
 |
7,835 |
16.23% |
| Oth |
 |
1,603 |
3.32% |
| Maj |
 |
7,729 |
16.01% |
| Turn |
 |
48,275 |
64.51% |
|
|
 |
Stephen Dorrell
Conservative hold
|
| UK |
Jamie Bye |
1,603 |
3.32% |
| C |
Stephen Dorrell |
23,283 |
48.23% |
| LD |
Susan King |
7,835 |
16.23% |
| L |
Sean Sheahan |
15,554 |
32.22% |
|
Candidates representing 4 parties stood for election to this seat.
|
|
 |
Stephen Dorrell
Conservative
|
| Con |
 |
26,110 |
46.48% |
| Lab |
 |
20,210 |
35.98% |
| LD |
 |
7,224 |
12.86% |
| Ref |
 |
2,104 |
3.75% |
| Oth |
 |
525 |
0.93% |
| Maj |
 |
5,900 |
10.50% |
| Turn |
 |
56,173 |
77.28% |
|
|
 |
|
Conservative
|
| Con |
 |
35,126 |
60.60% |
| Lab |
 |
12,526 |
21.60% |
| LD |
 |
10,345 |
17.80% |
| Oth |
|
0 |
0.00% |
| Maj |
 |
22,600 |
39.00% |
| Turn |
 |
57,997 |
80.92% |
|
|
 |
|

|

