|
Chatham & Aylesford
Labour hold

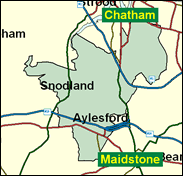
Neither the Medway Kent town of Chatham itself, working class and rough but with a strong historic connection with the services through its dockyard, nor the inland voters around the small town of Aylesford, form good territory for Labour in an even year. This really is a difficult seat for Labour to hold, and if their overall majority is reduced at all in 2001 it will probably fall. The Tonbridge and Malling wards in the seat were all won by other parties in the May 1999 local elections, except those in Snodland, and the Medway Towns unitary authority sector was fairly evenly divided in 2000. The councillors elected for Labour in Holcombe ward were headed by one J.Shaw and Mrs Shaw, and this might indeed represent the future for the current MP.

Jonathan Shaw, one of Labour's surprise winners in 1997, came with the standard pedigree of local councillor and social worker. Born locally in 1966 and educated at Vintners' Boys' School, Maidstone and at colleges of further education, he has concentrated on local concerns such as radiation from nuclear submarines at Chatham, Tory-controlled Kent County Council's school spending cuts, Channel Tunnel safety, and Kent's pressure from asylum seekers. He rebelled on lone parent benefit cuts in 1997 and again in 2000 over air traffic control privatisation, but in March 2001 earned sketch-writers' headlines for a scripted intervention urging Blair to "save the pounds" of Tory spending cuts. His Tory opponent is Sean Holden, a journalist and broadcaster with Meridian TV at Southampton. Born 1955, educated at the Salesian (RC) College, Farnborough and at Exeter University, he was 1997 News Journalist of the Year, having been head of broadcasting at Conservative Central Office under Chris Patten in 1992. More recently he advised General Sir Michael Jackson on media operations before the Kosovo operation.

 |
| Wealthy Achievers, Suburban Areas |
8.76% |
14.99% |
58.41 |
|
| Affluent Greys, Rural Communities |
0.00% |
2.13% |
0.00 |
|
| Prosperous Pensioners, Retirement Areas |
0.00% |
2.49% |
0.00 |
|
| Affluent Executives, Family Areas |
10.34% |
4.43% |
233.60 |
|
| Well-Off Workers, Family Areas |
23.57% |
7.27% |
324.07 |
|
| Affluent Urbanites, Town & City Areas |
0.56% |
2.56% |
21.65 |
|
| Prosperous Professionals, Metropolitan Areas |
0.00% |
2.04% |
0.00 |
|
| Better-Off Executives, Inner City Areas |
0.74% |
3.94% |
18.79 |
|
| Comfortable Middle Agers, Mature Home Owning Areas |
10.38% |
13.04% |
79.59 |
|
| Skilled Workers, Home Owning Areas |
25.93% |
12.70% |
204.10 |
|
| New Home Owners, Mature Communities |
4.61% |
8.14% |
56.61 |
|
| White Collar Workers, Better-Off Multi Ethnic Areas |
1.54% |
4.02% |
38.41 |
|
| Older People, Less Prosperous Areas |
3.64% |
3.19% |
114.24 |
|
| Council Estate Residents, Better-Off Homes |
8.33% |
11.31% |
73.65 |
|
| Council Estate Residents, High Unemployment |
0.95% |
3.06% |
31.10 |
|
| Council Estate Residents, Greatest Hardship |
0.63% |
2.52% |
24.99 |
|
| People in Multi-Ethnic, Low-Income Areas |
0.00% |
2.10% |
0.00 |
|
| Unclassified |
0.03% |
0.06% |
44.27 |
|
|
 |
 |
 |
| £0-5K |
7.95% |
9.41% |
84.46 |
|
| £5-10K |
15.03% |
16.63% |
90.37 |
|
| £10-15K |
16.22% |
16.58% |
97.83 |
|
| £15-20K |
14.10% |
13.58% |
103.78 |
|
| £20-25K |
11.20% |
10.39% |
107.81 |
|
| £25-30K |
8.56% |
7.77% |
110.12 |
|
| £30-35K |
6.43% |
5.79% |
111.07 |
|
| £35-40K |
4.81% |
4.33% |
111.01 |
|
| £40-45K |
3.60% |
3.27% |
110.22 |
|
| £45-50K |
2.70% |
2.48% |
108.92 |
|
| £50-55K |
2.04% |
1.90% |
107.29 |
|
| £55-60K |
1.55% |
1.47% |
105.45 |
|
| £60-65K |
1.19% |
1.15% |
103.49 |
|
| £65-70K |
0.92% |
0.91% |
101.48 |
|
| £70-75K |
0.72% |
0.72% |
99.46 |
|
| £75-80K |
0.56% |
0.57% |
97.46 |
|
| £80-85K |
0.44% |
0.46% |
95.50 |
|
| £85-90K |
0.35% |
0.37% |
93.60 |
|
| £90-95K |
0.28% |
0.31% |
91.77 |
|
| £95-100K |
0.23% |
0.25% |
90.01 |
|
| £100K + |
1.08% |
1.34% |
80.48 |
|
|
|

|


|
1992-1997
|
1997-2001
|
|
|
|
| Con |
-13.87% |
| Lab |
16.41% |
| LD |
-6.27% |
|
| Con |
-0.08% |
| Lab |
5.16% |
| LD |
-3.19% |
|
|
 |
Jonathan Shaw
Labour hold
|
| Con |
 |
14,840 |
37.35% |
| Lab |
 |
19,180 |
48.27% |
| LD |
 |
4,705 |
11.84% |
| Oth |
 |
1,010 |
2.54% |
| Maj |
 |
4,340 |
10.92% |
| Turn |
 |
39,735 |
56.96% |
|
|
 |
Jonathan Shaw
Labour hold
|
| C |
Sean Holden |
14,840 |
37.35% |
| UK |
Gregory Knopp |
1,010 |
2.54% |
| LD |
David Lettingdon |
4,705 |
11.84% |
| L |
Jonathan Shaw |
19,180 |
48.27% |
|
Candidates representing 4 parties stood for election to this seat.
|
|
 |
Jonathan Shaw
Labour gain
|
| Con |
 |
18,401 |
37.43% |
| Lab |
 |
21,191 |
43.11% |
| LD |
 |
7,389 |
15.03% |
| Ref |
 |
1,538 |
3.13% |
| Oth |
 |
642 |
1.31% |
| Maj |
 |
2,790 |
5.68% |
| Turn |
 |
49,161 |
71.07% |
|
|
 |
|
Conservative
|
| Con |
 |
28,056 |
51.30% |
| Lab |
 |
14,633 |
26.70% |
| LD |
 |
11,643 |
21.30% |
| Oth |
 |
401 |
0.70% |
| Maj |
 |
13,423 |
24.50% |
| Turn |
 |
54,733 |
78.39% |
|
|
 |
|

|

