|
Cheadle
Liberal Democrat gain

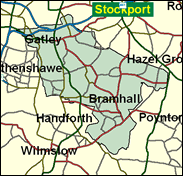
One of only two seats won by the Conservatives out of 28 in Greater Manchester in 1997, Cheadle still only returned a shaky majority of 3,000. This is the less Liberal part of the middle class Cheshire commuter belt section of Stockport Borough, including the most upmarket neighbourhoods in the area, Bramhall and Gatley; despite its name, it does not have a history of Liberal MPs when separated from the wards contained in the next door seat of Hazel Grove (Michael Winstanley was twice elected for the enlarged Cheadle seat as a Liberal in 1966 and February 1974). Although the Lib Dems do fairly well in local elections even in the Cheadle section, few seriously give them a chance in this 75pc middle class and 88pc owner occupied division - the latter figure the third highest of the 659 constituencies.

Stephen Day, MP here since 1987, now a Tory Whip in opposition, was long unpromoted in Government, where he revolted against eye and dental inspection charges, poll tax banding, pit closures and Post Office privatisation. From a Yorkshire working-class background, he was born in 1948, attended Otley Secondary School, further education college in Leeds, and Leeds Polytechnic, and worked as a salesman, eventually in printing companies. He sides with the Turks in Northern Cyprus and votes for the foxes against the huntsmen. Liberal Democrat hopes here centre on Patsy Calton who fought the seat in 1992 and 1997. A comprehensive school chemistry teacher, she was born in 1948, educated at Wymondham College, Norfolk and UMIST and has been a local (Stockport) councillor since 1994. She needs a tactical squeeze on the still big Labour vote.

 |
| Wealthy Achievers, Suburban Areas |
56.85% |
14.99% |
379.15 |
|
| Affluent Greys, Rural Communities |
0.00% |
2.13% |
0.00 |
|
| Prosperous Pensioners, Retirement Areas |
1.49% |
2.49% |
59.89 |
|
| Affluent Executives, Family Areas |
6.18% |
4.43% |
139.77 |
|
| Well-Off Workers, Family Areas |
7.66% |
7.27% |
105.30 |
|
| Affluent Urbanites, Town & City Areas |
0.61% |
2.56% |
23.93 |
|
| Prosperous Professionals, Metropolitan Areas |
0.09% |
2.04% |
4.60 |
|
| Better-Off Executives, Inner City Areas |
0.13% |
3.94% |
3.32 |
|
| Comfortable Middle Agers, Mature Home Owning Areas |
22.34% |
13.04% |
171.33 |
|
| Skilled Workers, Home Owning Areas |
1.17% |
12.70% |
9.24 |
|
| New Home Owners, Mature Communities |
1.17% |
8.14% |
14.32 |
|
| White Collar Workers, Better-Off Multi Ethnic Areas |
0.00% |
4.02% |
0.00 |
|
| Older People, Less Prosperous Areas |
1.21% |
3.19% |
38.04 |
|
| Council Estate Residents, Better-Off Homes |
0.63% |
11.31% |
5.59 |
|
| Council Estate Residents, High Unemployment |
0.45% |
3.06% |
14.78 |
|
| Council Estate Residents, Greatest Hardship |
0.00% |
2.52% |
0.00 |
|
| People in Multi-Ethnic, Low-Income Areas |
0.00% |
2.10% |
0.00 |
|
| Unclassified |
0.00% |
0.06% |
7.17 |
|
|
 |
 |
 |
| £0-5K |
4.29% |
9.41% |
45.59 |
|
| £5-10K |
9.80% |
16.63% |
58.94 |
|
| £10-15K |
12.51% |
16.58% |
75.43 |
|
| £15-20K |
12.52% |
13.58% |
92.15 |
|
| £20-25K |
11.21% |
10.39% |
107.85 |
|
| £25-30K |
9.48% |
7.77% |
121.99 |
|
| £30-35K |
7.79% |
5.79% |
134.41 |
|
| £35-40K |
6.29% |
4.33% |
145.13 |
|
| £40-45K |
5.04% |
3.27% |
154.27 |
|
| £45-50K |
4.02% |
2.48% |
161.98 |
|
| £50-55K |
3.21% |
1.90% |
168.43 |
|
| £55-60K |
2.56% |
1.47% |
173.78 |
|
| £60-65K |
2.05% |
1.15% |
178.18 |
|
| £65-70K |
1.65% |
0.91% |
181.77 |
|
| £70-75K |
1.33% |
0.72% |
184.65 |
|
| £75-80K |
1.07% |
0.57% |
186.94 |
|
| £80-85K |
0.87% |
0.46% |
188.71 |
|
| £85-90K |
0.71% |
0.37% |
190.04 |
|
| £90-95K |
0.58% |
0.31% |
190.99 |
|
| £95-100K |
0.48% |
0.25% |
191.62 |
|
| £100K + |
2.53% |
1.34% |
188.17 |
|
|
|

|


|
1992-1997
|
1997-2001
|
|
|
|
| Con |
-13.97% |
| Lab |
3.33% |
| LD |
8.06% |
|
| Con |
-1.44% |
| Lab |
-1.77% |
| LD |
4.72% |
|
|
 |
Patsy Calton
Liberal Democrat gain
|
| Con |
 |
18,444 |
42.30% |
| Lab |
 |
6,086 |
13.96% |
| LD |
 |
18,477 |
42.37% |
| Oth |
 |
599 |
1.37% |
| Maj |
 |
33 |
0.08% |
| Turn |
 |
43,606 |
63.20% |
|
|
 |
Patsy Calton
Liberal Democrat gain
|
| LD |
Patsy Calton |
18,477 |
42.37% |
| UK |
Vincent Cavanagh |
599 |
1.37% |
| L |
Howard Dauber |
6,086 |
13.96% |
| C |
Stephen Day |
18,444 |
42.30% |
|
Candidates representing 4 parties stood for election to this seat.
|
|
 |
Stephen Day
Conservative
|
| Con |
 |
22,944 |
43.73% |
| Lab |
 |
8,253 |
15.73% |
| LD |
 |
19,755 |
37.66% |
| Ref |
 |
1,511 |
2.88% |
| Oth |
|
0 |
0.00% |
| Maj |
 |
3,189 |
6.08% |
| Turn |
 |
52,463 |
77.58% |
|
|
 |
|
Conservative
|
| Con |
 |
32,804 |
57.70% |
| Lab |
 |
7,080 |
12.40% |
| LD |
 |
16,828 |
29.60% |
| Oth |
 |
183 |
0.30% |
| Maj |
 |
15,976 |
28.10% |
| Turn |
 |
56,895 |
82.71% |
|
|
 |
|

|

