|
Chelmsford West
Conservative hold

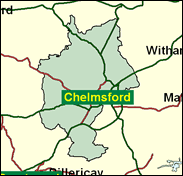
Chelmsford West actually includes the whole of the centre of the county town of Essex. If you want to find Chelmsford East, you have to look under Maldon and Chelmsford East. This is one place where a high-profile MP did not necessarily bring electoral rewards for his party, for the Liberals often pressed Norman St John-Stevas very close during his tenure here in the 1970s and early 1980s. Perhaps his style was somewhat effete and cultivated for Essex. In any case when Simon Burns took over in 1987 the Lib Dem threat subsided, and now the opposition is fairly evenly divided between that party and Labour. As long as this remains true, Burns will continue to win comfortably.

Simon Burns was originally elected for Chelmsford in 1987, a seat he rebuilt into a safe one following its decay into a tight Conservative-Liberal marginal during the incumbency of Norman St. John Stevas. A junior minister under Major, he was dropped as an opposition spokesman under Hague in 1999. Born 1952 and educated at Stamford School and Worcester College, Oxford, he worked for Sally Oppenheim MP and for the IOD before becoming an MP. His political leanings have wobbled from Thatcherite zealot to a Major loyalist over Maastricht. Tall, with front combed centrally parted hair and with the jury divided on his cerebral capacity, he has sought to stop the run down of the local Marconi factories, and campaigned against football hooligans.

 |
| Wealthy Achievers, Suburban Areas |
19.42% |
14.99% |
129.54 |
|
| Affluent Greys, Rural Communities |
0.04% |
2.13% |
2.04 |
|
| Prosperous Pensioners, Retirement Areas |
1.72% |
2.49% |
69.08 |
|
| Affluent Executives, Family Areas |
14.61% |
4.43% |
330.23 |
|
| Well-Off Workers, Family Areas |
13.40% |
7.27% |
184.16 |
|
| Affluent Urbanites, Town & City Areas |
4.95% |
2.56% |
192.89 |
|
| Prosperous Professionals, Metropolitan Areas |
2.18% |
2.04% |
106.65 |
|
| Better-Off Executives, Inner City Areas |
0.88% |
3.94% |
22.30 |
|
| Comfortable Middle Agers, Mature Home Owning Areas |
18.75% |
13.04% |
143.83 |
|
| Skilled Workers, Home Owning Areas |
7.39% |
12.70% |
58.18 |
|
| New Home Owners, Mature Communities |
8.03% |
8.14% |
98.56 |
|
| White Collar Workers, Better-Off Multi Ethnic Areas |
1.97% |
4.02% |
49.04 |
|
| Older People, Less Prosperous Areas |
2.50% |
3.19% |
78.52 |
|
| Council Estate Residents, Better-Off Homes |
2.67% |
11.31% |
23.61 |
|
| Council Estate Residents, High Unemployment |
0.53% |
3.06% |
17.30 |
|
| Council Estate Residents, Greatest Hardship |
0.87% |
2.52% |
34.72 |
|
| People in Multi-Ethnic, Low-Income Areas |
0.00% |
2.10% |
0.00 |
|
| Unclassified |
0.09% |
0.06% |
137.34 |
|
|
 |
 |
 |
| £0-5K |
6.58% |
9.41% |
69.93 |
|
| £5-10K |
12.34% |
16.63% |
74.17 |
|
| £10-15K |
13.94% |
16.58% |
84.10 |
|
| £15-20K |
12.88% |
13.58% |
94.80 |
|
| £20-25K |
10.89% |
10.39% |
104.81 |
|
| £25-30K |
8.84% |
7.77% |
113.65 |
|
| £30-35K |
7.02% |
5.79% |
121.25 |
|
| £35-40K |
5.53% |
4.33% |
127.67 |
|
| £40-45K |
4.34% |
3.27% |
133.04 |
|
| £45-50K |
3.41% |
2.48% |
137.49 |
|
| £50-55K |
2.69% |
1.90% |
141.15 |
|
| £55-60K |
2.13% |
1.47% |
144.16 |
|
| £60-65K |
1.69% |
1.15% |
146.62 |
|
| £65-70K |
1.35% |
0.91% |
148.60 |
|
| £70-75K |
1.08% |
0.72% |
150.20 |
|
| £75-80K |
0.87% |
0.57% |
151.47 |
|
| £80-85K |
0.71% |
0.46% |
152.46 |
|
| £85-90K |
0.57% |
0.37% |
153.22 |
|
| £90-95K |
0.47% |
0.31% |
153.79 |
|
| £95-100K |
0.39% |
0.25% |
154.19 |
|
| £100K + |
2.06% |
1.34% |
153.39 |
|
|
|

|


|
1992-1997
|
1997-2001
|
|
|
|
| Con |
-14.20% |
| Lab |
11.25% |
| LD |
0.28% |
|
| Con |
1.87% |
| Lab |
3.11% |
| LD |
-5.92% |
|
|
 |
Simon Burns
Conservative hold
|
| Con |
 |
20,446 |
42.47% |
| Lab |
 |
14,185 |
29.46% |
| LD |
 |
11,197 |
23.26% |
| Oth |
 |
2,315 |
4.81% |
| Maj |
 |
6,261 |
13.01% |
| Turn |
 |
48,143 |
61.49% |
|
|
 |
Simon Burns
Conservative hold
|
| G |
Eleanor Burgess |
837 |
1.74% |
| C |
Simon Burns |
20,446 |
42.47% |
| L |
Adrian Longden |
14,185 |
29.46% |
| LCA |
Christopher Philbin |
693 |
1.44% |
| LD |
Stephen Robinson |
11,197 |
23.26% |
| UK |
Ken Wedon |
785 |
1.63% |
|
Candidates representing 6 parties stood for election to this seat.
|
|
 |
Simon Burns
Conservative
|
| Con |
 |
23,781 |
40.60% |
| Lab |
 |
15,436 |
26.35% |
| LD |
 |
17,090 |
29.18% |
| Ref |
 |
1,536 |
2.62% |
| Oth |
 |
734 |
1.25% |
| Maj |
 |
6,691 |
11.42% |
| Turn |
 |
58,577 |
76.99% |
|
|
 |
|
Conservative
|
| Con |
 |
34,284 |
54.80% |
| Lab |
 |
9,443 |
15.10% |
| LD |
 |
18,098 |
28.90% |
| Oth |
 |
699 |
1.10% |
| Maj |
 |
16,186 |
25.90% |
| Turn |
 |
62,524 |
84.93% |
|
|
 |
|

|

