|
Cheltenham
Liberal Democrat hold

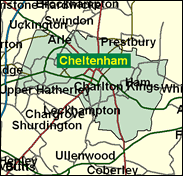
As in the case of the other large West Country spa town, Bath, Cheltenham has become a Liberal Democrat stronghold at both local and parliamentary level over the last couple of decades; indeed although their advance started on the council, they are now stronger in General Elections, as the Tories actually outpolled them in May 1999 and May 2000. Although injured in the stabbing assault at his constituency surgery in which his agent was killed, Liberal Democrat MP Nigel Jones will fight Cheltenham for a third time, and a third victory is to be expected as his party is now very well established in the distinguished and elegantly laid out Cotswolds town which is also a prosperous hub of commercial enterprise as well as the well publicised headquarters of the secret government communications centre, GCHQ.

Bearded, former ICI computer consultant Nigel Jones won the seat for the Liberal Democrats in 1992 on the back of white resentment of the black Conservative candidate. He held it in 1997, and narrowly missed being killed in January 1998 by a crazed samurai sword-wielding constituent, who killed a Liberal Democrat councillor during the attack. It was this incident that brought the uncharismatic Jones, born locally in 1944 and educated at Prince Henry's Grammar School, Evesham, to national public attention, though he had long been an effective ward heeler in his constituency, especially on the big local issue of union rights at GCHQ.

 |
| Wealthy Achievers, Suburban Areas |
17.63% |
14.99% |
117.56 |
|
| Affluent Greys, Rural Communities |
0.00% |
2.13% |
0.00 |
|
| Prosperous Pensioners, Retirement Areas |
3.94% |
2.49% |
158.66 |
|
| Affluent Executives, Family Areas |
1.65% |
4.43% |
37.17 |
|
| Well-Off Workers, Family Areas |
4.62% |
7.27% |
63.56 |
|
| Affluent Urbanites, Town & City Areas |
6.41% |
2.56% |
250.12 |
|
| Prosperous Professionals, Metropolitan Areas |
1.58% |
2.04% |
77.23 |
|
| Better-Off Executives, Inner City Areas |
8.12% |
3.94% |
205.88 |
|
| Comfortable Middle Agers, Mature Home Owning Areas |
13.70% |
13.04% |
105.09 |
|
| Skilled Workers, Home Owning Areas |
11.51% |
12.70% |
90.59 |
|
| New Home Owners, Mature Communities |
8.73% |
8.14% |
107.19 |
|
| White Collar Workers, Better-Off Multi Ethnic Areas |
8.63% |
4.02% |
214.64 |
|
| Older People, Less Prosperous Areas |
2.87% |
3.19% |
90.09 |
|
| Council Estate Residents, Better-Off Homes |
7.16% |
11.31% |
63.31 |
|
| Council Estate Residents, High Unemployment |
0.82% |
3.06% |
26.79 |
|
| Council Estate Residents, Greatest Hardship |
2.37% |
2.52% |
93.99 |
|
| People in Multi-Ethnic, Low-Income Areas |
0.00% |
2.10% |
0.00 |
|
| Unclassified |
0.26% |
0.06% |
421.12 |
|
|
 |
 |
 |
| £0-5K |
9.29% |
9.41% |
98.70 |
|
| £5-10K |
16.37% |
16.63% |
98.44 |
|
| £10-15K |
16.65% |
16.58% |
100.42 |
|
| £15-20K |
13.82% |
13.58% |
101.77 |
|
| £20-25K |
10.63% |
10.39% |
102.32 |
|
| £25-30K |
7.95% |
7.77% |
102.30 |
|
| £30-35K |
5.90% |
5.79% |
101.92 |
|
| £35-40K |
4.39% |
4.33% |
101.35 |
|
| £40-45K |
3.29% |
3.27% |
100.68 |
|
| £45-50K |
2.48% |
2.48% |
99.98 |
|
| £50-55K |
1.89% |
1.90% |
99.27 |
|
| £55-60K |
1.45% |
1.47% |
98.58 |
|
| £60-65K |
1.13% |
1.15% |
97.90 |
|
| £65-70K |
0.88% |
0.91% |
97.25 |
|
| £70-75K |
0.69% |
0.72% |
96.63 |
|
| £75-80K |
0.55% |
0.57% |
96.04 |
|
| £80-85K |
0.44% |
0.46% |
95.47 |
|
| £85-90K |
0.36% |
0.37% |
94.93 |
|
| £90-95K |
0.29% |
0.31% |
94.41 |
|
| £95-100K |
0.23% |
0.25% |
93.91 |
|
| £100K + |
1.22% |
1.34% |
90.87 |
|
|
|

|


|
1992-1997
|
1997-2001
|
|
|
|
| Con |
-7.96% |
| Lab |
3.44% |
| LD |
1.85% |
|
| Con |
-1.07% |
| Lab |
1.91% |
| LD |
-1.72% |
|
|
 |
Nigel Jones
Liberal Democrat hold
|
| Con |
 |
14,715 |
35.17% |
| Lab |
 |
5,041 |
12.05% |
| LD |
 |
19,970 |
47.74% |
| Oth |
 |
2,109 |
5.04% |
| Maj |
 |
5,255 |
12.56% |
| Turn |
 |
41,835 |
61.92% |
|
|
 |
Nigel Jones
Liberal Democrat hold
|
| G |
Keith Bessant |
735 |
1.76% |
| UK |
Jim Carver |
482 |
1.15% |
| L |
Andy Erlam |
5,041 |
12.05% |
| I |
Roger Everest |
107 |
0.26% |
| C |
Rob Garnham |
14,715 |
35.17% |
| P |
Anthony Gates |
272 |
0.65% |
| ML |
Dancing Ken Hanks |
513 |
1.23% |
| LD |
Nigel Jones |
19,970 |
47.74% |
|
Candidates representing 8 parties stood for election to this seat.
|
|
 |
Nigel Jones
Liberal Democrat
|
| Con |
 |
18,232 |
36.24% |
| Lab |
 |
5,100 |
10.14% |
| LD |
 |
24,877 |
49.45% |
| Ref |
 |
1,065 |
2.12% |
| Oth |
 |
1,029 |
2.05% |
| Maj |
 |
6,645 |
13.21% |
| Turn |
 |
50,303 |
74.03% |
|
|
 |
|
Liberal Democrat
|
| Con |
 |
24,861 |
44.20% |
| Lab |
 |
3,769 |
6.70% |
| LD |
 |
26,808 |
47.60% |
| Oth |
 |
858 |
1.50% |
| Maj |
 |
1,947 |
3.50% |
| Turn |
 |
56,296 |
81.45% |
|
|
 |
|

|

