|
Chesham & Amersham
Conservative hold

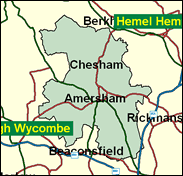
The Chilterns in Buckinghamshire are a very Conservative area. If an imaginary Tory fanatic were to insist on living in a part of Britain controlled at all levels by that party, they would have no better chance than here: after 1993 only one county council remained under overall control of the Conservatives (Bucks) and within it only the Chiltern, South Bucks and Wycombe districts. Until 1997 the government of the land was of of course Tory. Now this cannot be arranged, but the continued Conservatism of Chesham and Amersham is assured. Even in 1997 Cheryl Gillan won by 26pc of the vote, which puts this tenth in the list of safety.

Cheryl Gillan, a jolly hockey sticks but partisan and occasionally petulant spokesman on foreign affairs, is one of only 14 Tory women MPs , only six of whom are frontbenchers. Elected in 1992, she was born in 1952, educated at Cheltenham Ladies College and at law college, but worked in accountancy marketing. A junior minister at Education and Employment at the fag-end of the Major government, she is one of several MPs to have experienced mugging, bravely chasing her assailant for several hundred yards in stockinged feet. She has been in and out of the Positive Europe Group and was pressed by her constituency party in 1996 to lobby Major against his European policy.

 |
| Wealthy Achievers, Suburban Areas |
59.26% |
14.99% |
395.26 |
|
| Affluent Greys, Rural Communities |
0.09% |
2.13% |
4.25 |
|
| Prosperous Pensioners, Retirement Areas |
1.69% |
2.49% |
68.16 |
|
| Affluent Executives, Family Areas |
3.24% |
4.43% |
73.27 |
|
| Well-Off Workers, Family Areas |
7.78% |
7.27% |
106.97 |
|
| Affluent Urbanites, Town & City Areas |
2.58% |
2.56% |
100.52 |
|
| Prosperous Professionals, Metropolitan Areas |
0.55% |
2.04% |
26.98 |
|
| Better-Off Executives, Inner City Areas |
0.00% |
3.94% |
0.00 |
|
| Comfortable Middle Agers, Mature Home Owning Areas |
11.19% |
13.04% |
85.84 |
|
| Skilled Workers, Home Owning Areas |
3.91% |
12.70% |
30.79 |
|
| New Home Owners, Mature Communities |
2.55% |
8.14% |
31.28 |
|
| White Collar Workers, Better-Off Multi Ethnic Areas |
0.53% |
4.02% |
13.27 |
|
| Older People, Less Prosperous Areas |
2.46% |
3.19% |
77.12 |
|
| Council Estate Residents, Better-Off Homes |
4.12% |
11.31% |
36.43 |
|
| Council Estate Residents, High Unemployment |
0.04% |
3.06% |
1.25 |
|
| Council Estate Residents, Greatest Hardship |
0.00% |
2.52% |
0.00 |
|
| People in Multi-Ethnic, Low-Income Areas |
0.00% |
2.10% |
0.00 |
|
| Unclassified |
0.00% |
0.06% |
0.00 |
|
|
 |
 |
 |
| £0-5K |
3.88% |
9.41% |
41.23 |
|
| £5-10K |
8.18% |
16.63% |
49.18 |
|
| £10-15K |
10.34% |
16.58% |
62.39 |
|
| £15-20K |
10.62% |
13.58% |
78.22 |
|
| £20-25K |
9.92% |
10.39% |
95.44 |
|
| £25-30K |
8.81% |
7.77% |
113.31 |
|
| £30-35K |
7.61% |
5.79% |
131.32 |
|
| £35-40K |
6.46% |
4.33% |
149.12 |
|
| £40-45K |
5.44% |
3.27% |
166.47 |
|
| £45-50K |
4.55% |
2.48% |
183.23 |
|
| £50-55K |
3.80% |
1.90% |
199.31 |
|
| £55-60K |
3.16% |
1.47% |
214.65 |
|
| £60-65K |
2.64% |
1.15% |
229.25 |
|
| £65-70K |
2.20% |
0.91% |
243.10 |
|
| £70-75K |
1.84% |
0.72% |
256.22 |
|
| £75-80K |
1.54% |
0.57% |
268.63 |
|
| £80-85K |
1.30% |
0.46% |
280.36 |
|
| £85-90K |
1.09% |
0.37% |
291.45 |
|
| £90-95K |
0.92% |
0.31% |
301.92 |
|
| £95-100K |
0.78% |
0.25% |
311.81 |
|
| £100K + |
4.87% |
1.34% |
362.06 |
|
|
|

|


|
1992-1997
|
1997-2001
|
|
|
|
| Con |
-13.02% |
| Lab |
9.22% |
| LD |
-0.67% |
|
| Con |
0.12% |
| Lab |
-0.85% |
| LD |
0.43% |
|
|
 |
Cheryl Gillan
Conservative hold
|
| Con |
 |
22,867 |
50.50% |
| Lab |
 |
8,497 |
18.76% |
| LD |
 |
10,985 |
24.26% |
| Oth |
 |
2,934 |
6.48% |
| Maj |
 |
11,882 |
26.24% |
| Turn |
 |
45,283 |
64.67% |
|
|
 |
Cheryl Gillan
Conservative hold
|
| P |
Gillian Duval |
453 |
1.00% |
| LD |
John Ford |
10,985 |
24.26% |
| C |
Cheryl Gillan |
22,867 |
50.50% |
| UK |
Ian Harvey |
1,367 |
3.02% |
| L |
Ken Hulme |
8,497 |
18.76% |
| G |
Nick Wilkins |
1,114 |
2.46% |
|
Candidates representing 6 parties stood for election to this seat.
|
|
 |
Cheryl Gillian
Conservative
|
| Con |
 |
26,298 |
50.38% |
| Lab |
 |
10,240 |
19.62% |
| LD |
 |
12,439 |
23.83% |
| Ref |
 |
2,528 |
4.84% |
| Oth |
 |
692 |
1.33% |
| Maj |
 |
13,859 |
26.55% |
| Turn |
 |
52,197 |
75.38% |
|
|
 |
|
Conservative
|
| Con |
 |
35,207 |
63.40% |
| Lab |
 |
5,758 |
10.40% |
| LD |
 |
13,606 |
24.50% |
| Oth |
 |
982 |
1.80% |
| Maj |
 |
21,601 |
38.90% |
| Turn |
 |
55,553 |
80.98% |
|
|
 |
|

|

