|
Chester, City of
Labour hold

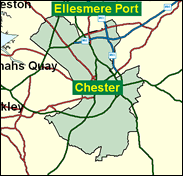
Chester was held by the Conservatives in Labour's landslide of 1966, but the long term swing to Labour in the north west certainly reached the Cheshire county town, with its well known tourist attractions (cathedral, zoo, walls, and an upper-storey medieval shop layout known as the rows). Besides the middle class residential areas such as that portrayed on the Channel 4 youth soap opera Hollyoaks, there are large Labour supporting council estates here such as Blacon, which looks as working class as anything on Merseyside. Gyles Brandreth added some froth to the Commons during his one term here, but he was thrown out by a decisive five figure majority. He is unlikely to reappear on the green benches, but he remains a regular elsewhere: on Channel 4 on Countdown, and in Stratford upon Avon he runs an excellent Teddy Bear museum.

Christine Russell, a former librarian and PA to Labour MEPs, won here for Labour in 1997. Born 1945 and educated at Spalding High School and Northwest London Polytechnic, she has been a loyal, unobtrusive, locally-focused MP, who tabled a mere eight written questions in her first year. Her selection from an all-women shortlist was re-run after the suspension of the practice in 1996.

 |
| Wealthy Achievers, Suburban Areas |
28.90% |
14.99% |
192.75 |
|
| Affluent Greys, Rural Communities |
0.54% |
2.13% |
25.50 |
|
| Prosperous Pensioners, Retirement Areas |
3.31% |
2.49% |
133.02 |
|
| Affluent Executives, Family Areas |
3.42% |
4.43% |
77.31 |
|
| Well-Off Workers, Family Areas |
2.39% |
7.27% |
32.85 |
|
| Affluent Urbanites, Town & City Areas |
2.89% |
2.56% |
112.51 |
|
| Prosperous Professionals, Metropolitan Areas |
0.09% |
2.04% |
4.20 |
|
| Better-Off Executives, Inner City Areas |
6.17% |
3.94% |
156.45 |
|
| Comfortable Middle Agers, Mature Home Owning Areas |
16.84% |
13.04% |
129.16 |
|
| Skilled Workers, Home Owning Areas |
4.11% |
12.70% |
32.34 |
|
| New Home Owners, Mature Communities |
7.49% |
8.14% |
91.95 |
|
| White Collar Workers, Better-Off Multi Ethnic Areas |
7.49% |
4.02% |
186.32 |
|
| Older People, Less Prosperous Areas |
3.23% |
3.19% |
101.27 |
|
| Council Estate Residents, Better-Off Homes |
7.46% |
11.31% |
65.94 |
|
| Council Estate Residents, High Unemployment |
2.11% |
3.06% |
68.94 |
|
| Council Estate Residents, Greatest Hardship |
3.40% |
2.52% |
135.02 |
|
| People in Multi-Ethnic, Low-Income Areas |
0.00% |
2.10% |
0.00 |
|
| Unclassified |
0.17% |
0.06% |
276.63 |
|
|
 |
 |
 |
| £0-5K |
8.71% |
9.41% |
92.52 |
|
| £5-10K |
15.28% |
16.63% |
91.89 |
|
| £10-15K |
15.61% |
16.58% |
94.14 |
|
| £15-20K |
13.26% |
13.58% |
97.65 |
|
| £20-25K |
10.53% |
10.39% |
101.35 |
|
| £25-30K |
8.14% |
7.77% |
104.71 |
|
| £30-35K |
6.23% |
5.79% |
107.58 |
|
| £35-40K |
4.76% |
4.33% |
109.92 |
|
| £40-45K |
3.65% |
3.27% |
111.78 |
|
| £45-50K |
2.81% |
2.48% |
113.22 |
|
| £50-55K |
2.18% |
1.90% |
114.33 |
|
| £55-60K |
1.70% |
1.47% |
115.15 |
|
| £60-65K |
1.33% |
1.15% |
115.75 |
|
| £65-70K |
1.05% |
0.91% |
116.17 |
|
| £70-75K |
0.84% |
0.72% |
116.43 |
|
| £75-80K |
0.67% |
0.57% |
116.58 |
|
| £80-85K |
0.54% |
0.46% |
116.64 |
|
| £85-90K |
0.44% |
0.37% |
116.62 |
|
| £90-95K |
0.36% |
0.31% |
116.54 |
|
| £95-100K |
0.29% |
0.25% |
116.42 |
|
| £100K + |
1.54% |
1.34% |
114.68 |
|
|
|

|


|
1992-1997
|
1997-2001
|
|
|
|
| Con |
-10.48% |
| Lab |
12.38% |
| LD |
-4.08% |
|
| Con |
-1.10% |
| Lab |
-4.49% |
| LD |
5.17% |
|
|
 |
Christine Russell
Labour hold
|
| Con |
 |
14,866 |
33.13% |
| Lab |
 |
21,760 |
48.49% |
| LD |
 |
6,589 |
14.68% |
| Oth |
 |
1,662 |
3.70% |
| Maj |
 |
6,894 |
15.36% |
| Turn |
 |
44,877 |
63.76% |
|
|
 |
Christine Russell
Labour hold
|
| LD |
Tony Dawson |
6,589 |
14.68% |
| C |
David Jones |
14,866 |
33.13% |
| I |
George Rogers |
763 |
1.70% |
| L |
Christine Russell |
21,760 |
48.49% |
| UK |
Allan Weddell |
899 |
2.00% |
|
Candidates representing 5 parties stood for election to this seat.
|
|
 |
Christine Russell
Labour gain
|
| Con |
 |
19,253 |
34.22% |
| Lab |
 |
29,806 |
52.98% |
| LD |
 |
5,353 |
9.52% |
| Ref |
 |
1,487 |
2.64% |
| Oth |
 |
358 |
0.64% |
| Maj |
 |
10,553 |
18.76% |
| Turn |
 |
56,257 |
78.43% |
|
|
 |
|
Conservative
|
| Con |
 |
25,641 |
44.70% |
| Lab |
 |
23,281 |
40.60% |
| LD |
 |
7,808 |
13.60% |
| Oth |
 |
593 |
1.00% |
| Maj |
 |
2,360 |
4.10% |
| Turn |
 |
57,323 |
83.61% |
|
|
 |
|

|

