|
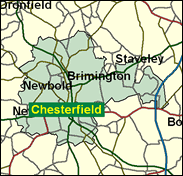
Chesterfield
Liberal Democrat gain

Tony Benn is finally to leave the Commons, which he has graced for the best part of fifty years, this time of his own volition, "to enter politics", his own mordant take on the current state of the independence of the Lower House of Parliament. He is not expected to (re)join the appointed House of Lords, which he regards as appointed and hence even more undemocratic. However, his son Hilary carries on the family's shortened name as MP, for Leeds Central. Chesterfield is likely to remain Labour, and although another left winger has been selected, it should not be assumed that Benn's departure will strengthen the strong but static Liberal Democrat vote recorded here throughout the Nineties.

As Tony Benn, the Labour activists' fading icon, hangs up his Doc Martens after 50 years of smooth-if-glib perorations, the only ex-MP among Labour candidates emerges here in the shape of Dr Reg Race. Tall and bald and from a family of Quakers, as MP for Wood Green from 1979 to 1983 he quit Tribune because it wasn't leftwing enough, and was the first MP to use the 'F' word in the House in a debate on sex shops. Born 1947 and educated at Sale Grammar School and Kent and Essex Universities, he was originally a NUPE research officer and after losing his seat in 1983 became a management consultant, latterly in the NHS. As an MP he opposed abolition of Ken Livingstone's GLC and went to work for it before it was wound up in 1986, but despite his leftwing past, he claims to be happy with the way the Blair government is going.
 |
| Wealthy Achievers, Suburban Areas |
8.93% |
14.99% |
59.56 |
|
| Affluent Greys, Rural Communities |
0.00% |
2.13% |
0.00 |
|
| Prosperous Pensioners, Retirement Areas |
0.53% |
2.49% |
21.26 |
|
| Affluent Executives, Family Areas |
3.45% |
4.43% |
77.98 |
|
| Well-Off Workers, Family Areas |
8.97% |
7.27% |
123.36 |
|
| Affluent Urbanites, Town & City Areas |
0.13% |
2.56% |
4.88 |
|
| Prosperous Professionals, Metropolitan Areas |
0.00% |
2.04% |
0.00 |
|
| Better-Off Executives, Inner City Areas |
0.92% |
3.94% |
23.30 |
|
| Comfortable Middle Agers, Mature Home Owning Areas |
14.43% |
13.04% |
110.68 |
|
| Skilled Workers, Home Owning Areas |
22.73% |
12.70% |
178.94 |
|
| New Home Owners, Mature Communities |
18.21% |
8.14% |
223.58 |
|
| White Collar Workers, Better-Off Multi Ethnic Areas |
0.98% |
4.02% |
24.34 |
|
| Older People, Less Prosperous Areas |
7.07% |
3.19% |
221.85 |
|
| Council Estate Residents, Better-Off Homes |
10.16% |
11.31% |
89.82 |
|
| Council Estate Residents, High Unemployment |
2.40% |
3.06% |
78.49 |
|
| Council Estate Residents, Greatest Hardship |
1.10% |
2.52% |
43.64 |
|
| People in Multi-Ethnic, Low-Income Areas |
0.00% |
2.10% |
0.00 |
|
| Unclassified |
0.00% |
0.06% |
0.00 |
|
|
 |
 |
 |
| £0-5K |
12.21% |
9.41% |
129.75 |
|
| £5-10K |
20.45% |
16.63% |
122.96 |
|
| £10-15K |
18.84% |
16.58% |
113.65 |
|
| £15-20K |
14.16% |
13.58% |
104.23 |
|
| £20-25K |
9.95% |
10.39% |
95.74 |
|
| £25-30K |
6.87% |
7.77% |
88.39 |
|
| £30-35K |
4.76% |
5.79% |
82.10 |
|
| £35-40K |
3.32% |
4.33% |
76.73 |
|
| £40-45K |
2.36% |
3.27% |
72.13 |
|
| £45-50K |
1.69% |
2.48% |
68.17 |
|
| £50-55K |
1.23% |
1.90% |
64.73 |
|
| £55-60K |
0.91% |
1.47% |
61.72 |
|
| £60-65K |
0.68% |
1.15% |
59.07 |
|
| £65-70K |
0.51% |
0.91% |
56.72 |
|
| £70-75K |
0.39% |
0.72% |
54.63 |
|
| £75-80K |
0.30% |
0.57% |
52.74 |
|
| £80-85K |
0.24% |
0.46% |
51.03 |
|
| £85-90K |
0.19% |
0.37% |
49.48 |
|
| £90-95K |
0.15% |
0.31% |
48.07 |
|
| £95-100K |
0.12% |
0.25% |
46.77 |
|
| £100K + |
0.55% |
1.34% |
40.57 |
|
|
|

|


|
1992-1997
|
1997-2001
|
|
|
|
| Con |
-7.65% |
| Lab |
3.50% |
| LD |
3.76% |
|
| Con |
-1.12% |
| Lab |
-8.80% |
| LD |
8.25% |
|
|
 |
Paul Holmes
Liberal Democrat gain
|
| Con |
 |
3,613 |
8.13% |
| Lab |
 |
18,663 |
42.00% |
| LD |
 |
21,249 |
47.81% |
| Oth |
 |
916 |
2.06% |
| Maj |
 |
2,586 |
5.82% |
| Turn |
 |
44,441 |
60.67% |
|
|
 |
Paul Holmes
Liberal Democrat gain
|
| SL |
Bill Harrison |
295 |
0.66% |
| C |
Simon Hitchcock |
3,613 |
8.13% |
| LD |
Paul Holmes |
21,249 |
47.81% |
| L |
Reg Race |
18,663 |
42.00% |
| I |
Christopher Rawson |
184 |
0.41% |
| SA |
Jeannie Robinson |
437 |
0.98% |
|
Candidates representing 6 parties stood for election to this seat.
|
|
 |
Tony Benn
Labour
|
| Con |
 |
4,752 |
9.25% |
| Lab |
 |
26,105 |
50.80% |
| LD |
 |
20,330 |
39.56% |
| Ref |
|
0 |
0.00% |
| Oth |
 |
202 |
0.39% |
| Maj |
 |
5,775 |
11.24% |
| Turn |
 |
51,389 |
70.91% |
|
|
 |
|
Labour
|
| Con |
 |
9,473 |
16.90% |
| Lab |
 |
26,461 |
47.30% |
| LD |
 |
20,047 |
35.80% |
| Oth |
|
0 |
0.00% |
| Maj |
 |
6,414 |
11.50% |
| Turn |
 |
55,981 |
76.25% |
|
|
 |
|

|

