|
Chichester
Conservative hold

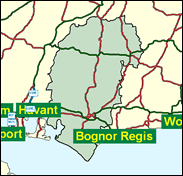
The Conservative majority in this verdant and wealthy slice of West Sussex, centred on the cathedral town of Chichester (much deluged with floods in recent months), dipped below 10,000 in 1997, but it is likely to surge again to take its place among the highest in the land, not only with a turn of the political tide, but because the Referendum party, which did much to disrupt the 1997 Tory campaign and obtained over 3,000 votes and saved their deposit here, have sunk more or less without trace.

Andrew Tyrie, a former special adviser to a string of Conservative ministers including John Major when PM, inherited the seat in 1997. Born 1957, and educated at Felsted School and Trinity College Oxford, the College of Europe Bruges, and Wolfson College Oxford, he comes without the orthodox line on Europe, where he is not opposed to monetary union on principle. Able, shrewd and patronising, and reflecting the fact that politicians say odd things in opposition (as Lord Hailsham did when attacking an 'elected dictatorship') he favours bi-cameralism made legitimate by election of the Lords, and attacks - as gamekeeper-turned-poacher - Labour’s sprawl of special advisers, especially Alastair Campbell.
 |
| Wealthy Achievers, Suburban Areas |
24.25% |
14.99% |
161.71 |
|
| Affluent Greys, Rural Communities |
5.49% |
2.13% |
258.34 |
|
| Prosperous Pensioners, Retirement Areas |
11.75% |
2.49% |
472.45 |
|
| Affluent Executives, Family Areas |
2.12% |
4.43% |
47.84 |
|
| Well-Off Workers, Family Areas |
3.29% |
7.27% |
45.18 |
|
| Affluent Urbanites, Town & City Areas |
0.35% |
2.56% |
13.64 |
|
| Prosperous Professionals, Metropolitan Areas |
0.00% |
2.04% |
0.00 |
|
| Better-Off Executives, Inner City Areas |
0.59% |
3.94% |
14.87 |
|
| Comfortable Middle Agers, Mature Home Owning Areas |
25.07% |
13.04% |
192.29 |
|
| Skilled Workers, Home Owning Areas |
2.59% |
12.70% |
20.40 |
|
| New Home Owners, Mature Communities |
12.93% |
8.14% |
158.84 |
|
| White Collar Workers, Better-Off Multi Ethnic Areas |
1.67% |
4.02% |
41.44 |
|
| Older People, Less Prosperous Areas |
4.50% |
3.19% |
141.19 |
|
| Council Estate Residents, Better-Off Homes |
4.44% |
11.31% |
39.28 |
|
| Council Estate Residents, High Unemployment |
0.59% |
3.06% |
19.18 |
|
| Council Estate Residents, Greatest Hardship |
0.01% |
2.52% |
0.39 |
|
| People in Multi-Ethnic, Low-Income Areas |
0.00% |
2.10% |
0.00 |
|
| Unclassified |
0.37% |
0.06% |
594.48 |
|
|
 |
 |
 |
| £0-5K |
8.40% |
9.41% |
89.28 |
|
| £5-10K |
15.57% |
16.63% |
93.62 |
|
| £10-15K |
16.13% |
16.58% |
97.27 |
|
| £15-20K |
13.58% |
13.58% |
99.97 |
|
| £20-25K |
10.60% |
10.39% |
102.03 |
|
| £25-30K |
8.06% |
7.77% |
103.65 |
|
| £30-35K |
6.08% |
5.79% |
104.95 |
|
| £35-40K |
4.59% |
4.33% |
106.02 |
|
| £40-45K |
3.49% |
3.27% |
106.92 |
|
| £45-50K |
2.67% |
2.48% |
107.69 |
|
| £50-55K |
2.06% |
1.90% |
108.37 |
|
| £55-60K |
1.61% |
1.47% |
108.97 |
|
| £60-65K |
1.26% |
1.15% |
109.53 |
|
| £65-70K |
1.00% |
0.91% |
110.05 |
|
| £70-75K |
0.80% |
0.72% |
110.55 |
|
| £75-80K |
0.64% |
0.57% |
111.02 |
|
| £80-85K |
0.52% |
0.46% |
111.49 |
|
| £85-90K |
0.42% |
0.37% |
111.95 |
|
| £90-95K |
0.34% |
0.31% |
112.40 |
|
| £95-100K |
0.28% |
0.25% |
112.85 |
|
| £100K + |
1.56% |
1.34% |
116.19 |
|
|
|

|


|
1992-1997
|
1997-2001
|
|
|
|
| Con |
-12.88% |
| Lab |
5.82% |
| LD |
2.37% |
|
| Con |
0.61% |
| Lab |
4.21% |
| LD |
-4.84% |
|
|
 |
Andrew Tyrie
Conservative hold
|
| Con |
 |
23,320 |
47.03% |
| Lab |
 |
10,627 |
21.43% |
| LD |
 |
11,965 |
24.13% |
| Oth |
 |
3,672 |
7.41% |
| Maj |
 |
11,355 |
22.90% |
| Turn |
 |
49,584 |
63.81% |
|
|
 |
Andrew Tyrie
Conservative hold
|
| L |
Celia Barlow |
10,627 |
21.43% |
| UK |
Douglas Denny |
2,380 |
4.80% |
| G |
Gavin Graham |
1,292 |
2.61% |
| LD |
Lynne Ravenscroft |
11,965 |
24.13% |
| C |
Andrew Tyrie |
23,320 |
47.03% |
|
Candidates representing 5 parties stood for election to this seat.
|
|
 |
Anthony Nelson
Conservative
|
| Con |
 |
25,895 |
46.42% |
| Lab |
 |
9,605 |
17.22% |
| LD |
 |
16,161 |
28.97% |
| Ref |
 |
3,318 |
5.95% |
| Oth |
 |
800 |
1.43% |
| Maj |
 |
9,734 |
17.45% |
| Turn |
 |
55,779 |
74.88% |
|
|
 |
|
Conservative
|
| Con |
 |
34,971 |
59.30% |
| Lab |
 |
6,703 |
11.40% |
| LD |
 |
15,690 |
26.60% |
| Oth |
 |
1,625 |
2.80% |
| Maj |
 |
19,281 |
32.70% |
| Turn |
 |
58,989 |
77.79% |
|
|
 |
|

|

