|
Chingford & Woodford Green
Conservative hold

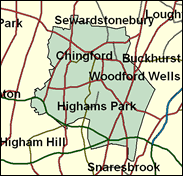
This seat has a right wing tradition to maintain. Norman Tebbit, one of Mrs Thatcher's most feared henchmen, was MP here for two decades and his successor Iain Duncan-Smith, elected in 1992, has in turn become a leading member of the shadow cabinet on the right of the party. Situated on the outer or Essex edge of the north east London Boroughs of Redbridge and Waltham Forest, Chingford and Woodford Green actually has a lower than average proportion of professional and managerial workers, and of adults with higher educational qualifications, but is is heavily owner occupied and over 90pc white. Lord Tebbit, the "Chingford Skinhead" will be relieved to know that his old seat has not deserted his brand of politics, even though the country has.

The presence of Iain Duncan-Smith, who succeeded Lord Tebbit at Chingford in 1992, in Hague’s Shadow Cabinet as Defence spokesman, confirms the hard Eurosceptic orthodoxy of the contemporary Conservative Party. Fastidious and cerebral, he was one of the most active Maastricht rebels, is bone dry on the economy, and was anti-Nolan. Son of a World War Two Group Captain, he was Scots-born in 1954, educated at HMS Conway and Sandhurst and spent six years in the Scots Guards before becoming a GEC Marconi executive and military book publisher. He initially backed Redwood in 1997, running his campaign and then, hesitantly, opted for Hague, who put him straight into the Shadow Cabinet from the backbenches. He soon threatened to go if his line on the single currency was diluted.
 |
| Wealthy Achievers, Suburban Areas |
17.92% |
14.99% |
119.50 |
|
| Affluent Greys, Rural Communities |
0.00% |
2.13% |
0.00 |
|
| Prosperous Pensioners, Retirement Areas |
3.07% |
2.49% |
123.65 |
|
| Affluent Executives, Family Areas |
0.00% |
4.43% |
0.00 |
|
| Well-Off Workers, Family Areas |
0.28% |
7.27% |
3.82 |
|
| Affluent Urbanites, Town & City Areas |
5.12% |
2.56% |
199.66 |
|
| Prosperous Professionals, Metropolitan Areas |
7.22% |
2.04% |
353.69 |
|
| Better-Off Executives, Inner City Areas |
0.85% |
3.94% |
21.64 |
|
| Comfortable Middle Agers, Mature Home Owning Areas |
23.76% |
13.04% |
182.21 |
|
| Skilled Workers, Home Owning Areas |
25.54% |
12.70% |
201.06 |
|
| New Home Owners, Mature Communities |
3.97% |
8.14% |
48.77 |
|
| White Collar Workers, Better-Off Multi Ethnic Areas |
5.75% |
4.02% |
142.95 |
|
| Older People, Less Prosperous Areas |
3.04% |
3.19% |
95.34 |
|
| Council Estate Residents, Better-Off Homes |
1.07% |
11.31% |
9.49 |
|
| Council Estate Residents, High Unemployment |
1.49% |
3.06% |
48.62 |
|
| Council Estate Residents, Greatest Hardship |
0.64% |
2.52% |
25.60 |
|
| People in Multi-Ethnic, Low-Income Areas |
0.27% |
2.10% |
13.03 |
|
| Unclassified |
0.00% |
0.06% |
0.00 |
|
|
 |
 |
 |
| £0-5K |
5.40% |
9.41% |
57.40 |
|
| £5-10K |
10.55% |
16.63% |
63.42 |
|
| £10-15K |
12.48% |
16.58% |
75.25 |
|
| £15-20K |
12.01% |
13.58% |
88.45 |
|
| £20-25K |
10.57% |
10.39% |
101.66 |
|
| £25-30K |
8.89% |
7.77% |
114.31 |
|
| £30-35K |
7.31% |
5.79% |
126.17 |
|
| £35-40K |
5.94% |
4.33% |
137.15 |
|
| £40-45K |
4.81% |
3.27% |
147.26 |
|
| £45-50K |
3.89% |
2.48% |
156.52 |
|
| £50-55K |
3.14% |
1.90% |
165.01 |
|
| £55-60K |
2.55% |
1.47% |
172.77 |
|
| £60-65K |
2.07% |
1.15% |
179.89 |
|
| £65-70K |
1.69% |
0.91% |
186.41 |
|
| £70-75K |
1.38% |
0.72% |
192.39 |
|
| £75-80K |
1.14% |
0.57% |
197.89 |
|
| £80-85K |
0.94% |
0.46% |
202.95 |
|
| £85-90K |
0.78% |
0.37% |
207.61 |
|
| £90-95K |
0.65% |
0.31% |
211.92 |
|
| £95-100K |
0.54% |
0.25% |
215.90 |
|
| £100K + |
3.15% |
1.34% |
234.20 |
|
|
|

|


|
1992-1997
|
1997-2001
|
|
|
|
| Con |
-13.91% |
| Lab |
13.64% |
| LD |
1.19% |
|
| Con |
0.73% |
| Lab |
-1.25% |
| LD |
0.03% |
|
|
 |
Iain Duncan-Smith
Conservative hold
|
| Con |
 |
17,834 |
48.22% |
| Lab |
 |
12,347 |
33.39% |
| LD |
 |
5,739 |
15.52% |
| Oth |
 |
1,062 |
2.87% |
| Maj |
 |
5,487 |
14.84% |
| Turn |
 |
36,982 |
58.47% |
|
|
 |
Iain Duncan-Smith
Conservative hold
|
| LD |
John Beanse |
5,739 |
15.52% |
| C |
Iain Duncan-Smith |
17,834 |
48.22% |
| BNP |
Jean Griffin |
1,062 |
2.87% |
| L |
Jessica Webb |
12,347 |
33.39% |
|
Candidates representing 4 parties stood for election to this seat.
|
|
 |
Iain Duncan Smith
Conservative
|
| Con |
 |
21,109 |
47.49% |
| Lab |
 |
15,395 |
34.64% |
| LD |
 |
6,885 |
15.49% |
| Ref |
|
0 |
0.00% |
| Oth |
 |
1,059 |
2.38% |
| Maj |
 |
5,714 |
12.86% |
| Turn |
 |
44,448 |
70.66% |
|
|
 |
|
Conservative
|
| Con |
 |
30,656 |
61.40% |
| Lab |
 |
10,455 |
21.00% |
| LD |
 |
7,154 |
14.30% |
| Oth |
 |
1,636 |
3.30% |
| Maj |
 |
20,201 |
40.50% |
| Turn |
 |
49,901 |
78.45% |
|
|
 |
|

|

