|
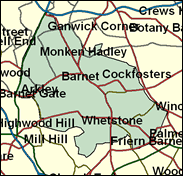
Chipping Barnet
Conservative hold

There are some parts of Greater London which were effectively annexed by the capital in the mid 1960s on the creation of the Greater London Council, which lasted just 21 years but which have not been returned to their former counties. Chipping Barnet in many ways feels part of Hertfordshire where it originated, but it is indeed still in the London Borough which bears its second name. This means that when it was held by Sir Sydney Chapman for the Tories by only 1,035 votes in the 1997 General Election, it was technically the second closest seat to yet another Labour gain, after Uxbridge; indeed a similar swing to that in neighbouring Harrow and Enfield seats would have polished it off, for the time being. As it happens, the Conservatives can be relieved, and they were further ahead in the local Barnet elections in May 1998 and the Euro-elections in 1999, and the worst may seem to have passed.

Fading after 21 years as Reggie Maudling’s successor here, Sir Sydney Chapman, a former architect, born 1935, educated at Rugby and Manchester University, was silenced by long years - up to 1997 - in the Whips’ Office. He now emerges as a genial non-partisan figure, keen on tree-planting in the green belt, a Liberal minded environmentalist and a Europhile.
 |
| Wealthy Achievers, Suburban Areas |
36.15% |
14.99% |
241.10 |
|
| Affluent Greys, Rural Communities |
0.00% |
2.13% |
0.00 |
|
| Prosperous Pensioners, Retirement Areas |
3.02% |
2.49% |
121.61 |
|
| Affluent Executives, Family Areas |
1.08% |
4.43% |
24.41 |
|
| Well-Off Workers, Family Areas |
0.54% |
7.27% |
7.38 |
|
| Affluent Urbanites, Town & City Areas |
9.06% |
2.56% |
353.16 |
|
| Prosperous Professionals, Metropolitan Areas |
17.98% |
2.04% |
880.78 |
|
| Better-Off Executives, Inner City Areas |
1.80% |
3.94% |
45.72 |
|
| Comfortable Middle Agers, Mature Home Owning Areas |
9.64% |
13.04% |
73.93 |
|
| Skilled Workers, Home Owning Areas |
6.35% |
12.70% |
49.98 |
|
| New Home Owners, Mature Communities |
5.00% |
8.14% |
61.44 |
|
| White Collar Workers, Better-Off Multi Ethnic Areas |
4.30% |
4.02% |
106.98 |
|
| Older People, Less Prosperous Areas |
1.00% |
3.19% |
31.25 |
|
| Council Estate Residents, Better-Off Homes |
2.48% |
11.31% |
21.94 |
|
| Council Estate Residents, High Unemployment |
0.94% |
3.06% |
30.80 |
|
| Council Estate Residents, Greatest Hardship |
0.65% |
2.52% |
25.87 |
|
| People in Multi-Ethnic, Low-Income Areas |
0.00% |
2.10% |
0.00 |
|
| Unclassified |
0.01% |
0.06% |
10.30 |
|
|
 |
 |
 |
| £0-5K |
4.56% |
9.41% |
48.39 |
|
| £5-10K |
9.37% |
16.63% |
56.32 |
|
| £10-15K |
11.50% |
16.58% |
69.37 |
|
| £15-20K |
11.44% |
13.58% |
84.23 |
|
| £20-25K |
10.35% |
10.39% |
99.55 |
|
| £25-30K |
8.92% |
7.77% |
114.67 |
|
| £30-35K |
7.49% |
5.79% |
129.24 |
|
| £35-40K |
6.20% |
4.33% |
143.07 |
|
| £40-45K |
5.10% |
3.27% |
156.08 |
|
| £45-50K |
4.18% |
2.48% |
168.25 |
|
| £50-55K |
3.42% |
1.90% |
179.60 |
|
| £55-60K |
2.80% |
1.47% |
190.16 |
|
| £60-65K |
2.30% |
1.15% |
199.99 |
|
| £65-70K |
1.90% |
0.91% |
209.13 |
|
| £70-75K |
1.57% |
0.72% |
217.64 |
|
| £75-80K |
1.30% |
0.57% |
225.57 |
|
| £80-85K |
1.08% |
0.46% |
232.95 |
|
| £85-90K |
0.90% |
0.37% |
239.85 |
|
| £90-95K |
0.75% |
0.31% |
246.29 |
|
| £95-100K |
0.63% |
0.25% |
252.32 |
|
| £100K + |
3.79% |
1.34% |
282.03 |
|
|
|

|


|
1992-1997
|
1997-2001
|
|
|
|
| Con |
-13.59% |
| Lab |
14.72% |
| LD |
-3.75% |
|
| Con |
3.40% |
| Lab |
-0.88% |
| LD |
1.20% |
|
|
 |
Sydney Chapman
Conservative hold
|
| Con |
 |
19,702 |
46.41% |
| Lab |
 |
17,001 |
40.04% |
| LD |
 |
5,753 |
13.55% |
| Oth |
|
0 |
0.00% |
| Maj |
 |
2,701 |
6.36% |
| Turn |
 |
42,456 |
60.46% |
|
|
 |
Sydney Chapman
Conservative hold
|
| C |
Sydney Chapman |
19,702 |
46.41% |
| LD |
Sean Hooker |
5,753 |
13.55% |
| L |
Damien Welfare |
17,001 |
40.04% |
|
Candidates representing 3 parties stood for election to this seat.
|
|
 |
Sidney Chapman
Conservative
|
| Con |
 |
21,317 |
43.01% |
| Lab |
 |
20,282 |
40.92% |
| LD |
 |
6,121 |
12.35% |
| Ref |
 |
1,190 |
2.40% |
| Oth |
 |
655 |
1.32% |
| Maj |
 |
1,035 |
2.09% |
| Turn |
 |
49,565 |
71.78% |
|
|
 |
|
Conservative
|
| Con |
 |
30,241 |
56.60% |
| Lab |
 |
14,028 |
26.20% |
| LD |
 |
8,594 |
16.10% |
| Oth |
 |
604 |
1.10% |
| Maj |
 |
16,213 |
30.30% |
| Turn |
 |
53,467 |
77.29% |
|
|
 |
|

|

