|
Chorley
Labour hold

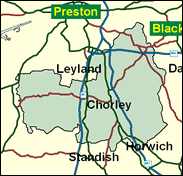
Yet another Lancashire marginal gained by Labour in 1997, Chorley seems a safer hold next time that some seats nearby, at least when analysing the results of very recent local elections. Whereas the Conservatives seized almost every ward in Hyndburn and Rossendale in May 2000, they only took 7 of the 16 available in Chorley Borough, and outpolled Labour by only 3pc across the 16 wards contested. This suggests that Lindsay Hoyle (son of Doug, the former Warrington MP) is in a strong position to resist the nine per cent negative swing needed to lose the Chorley seat.

Born into a life of politics as an MP’s son, if bearing little physical resemblance to his father Doug (now Lord) Hoyle, Lindsay Hoyle won Chorley for Labour in 1997. He proceeded to act as a local ambassador on job protection in aerospace, textiles and Royal Ordnance and defence of northwestern regionalist interests. Chubby-faced and beaky-nosed with a partly poshed-up version of his father’s voice, he was born in 1957, educated at Bolton School and FE college and owned a printing business. His ambivalent name must be blamed on his father who is of the generation who knew of the Australian cricket captain, Lindsay Hassett. In the wake of Princess Diana’s death he called for Heathrow Airport to be named after her.
 |
| Wealthy Achievers, Suburban Areas |
22.54% |
14.99% |
150.31 |
|
| Affluent Greys, Rural Communities |
0.00% |
2.13% |
0.00 |
|
| Prosperous Pensioners, Retirement Areas |
0.48% |
2.49% |
19.31 |
|
| Affluent Executives, Family Areas |
8.67% |
4.43% |
195.93 |
|
| Well-Off Workers, Family Areas |
17.05% |
7.27% |
234.39 |
|
| Affluent Urbanites, Town & City Areas |
0.17% |
2.56% |
6.48 |
|
| Prosperous Professionals, Metropolitan Areas |
0.00% |
2.04% |
0.00 |
|
| Better-Off Executives, Inner City Areas |
0.80% |
3.94% |
20.21 |
|
| Comfortable Middle Agers, Mature Home Owning Areas |
13.57% |
13.04% |
104.11 |
|
| Skilled Workers, Home Owning Areas |
17.26% |
12.70% |
135.86 |
|
| New Home Owners, Mature Communities |
6.44% |
8.14% |
79.09 |
|
| White Collar Workers, Better-Off Multi Ethnic Areas |
1.32% |
4.02% |
32.84 |
|
| Older People, Less Prosperous Areas |
2.52% |
3.19% |
78.98 |
|
| Council Estate Residents, Better-Off Homes |
8.47% |
11.31% |
74.84 |
|
| Council Estate Residents, High Unemployment |
0.20% |
3.06% |
6.39 |
|
| Council Estate Residents, Greatest Hardship |
0.50% |
2.52% |
19.70 |
|
| People in Multi-Ethnic, Low-Income Areas |
0.00% |
2.10% |
0.00 |
|
| Unclassified |
0.03% |
0.06% |
53.94 |
|
|
 |
 |
 |
| £0-5K |
7.35% |
9.41% |
78.07 |
|
| £5-10K |
14.95% |
16.63% |
89.86 |
|
| £10-15K |
16.06% |
16.58% |
96.89 |
|
| £15-20K |
13.81% |
13.58% |
101.70 |
|
| £20-25K |
10.93% |
10.39% |
105.17 |
|
| £25-30K |
8.38% |
7.77% |
107.75 |
|
| £30-35K |
6.35% |
5.79% |
109.68 |
|
| £35-40K |
4.81% |
4.33% |
111.12 |
|
| £40-45K |
3.66% |
3.27% |
112.17 |
|
| £45-50K |
2.80% |
2.48% |
112.90 |
|
| £50-55K |
2.16% |
1.90% |
113.38 |
|
| £55-60K |
1.68% |
1.47% |
113.66 |
|
| £60-65K |
1.31% |
1.15% |
113.78 |
|
| £65-70K |
1.03% |
0.91% |
113.75 |
|
| £70-75K |
0.82% |
0.72% |
113.62 |
|
| £75-80K |
0.65% |
0.57% |
113.40 |
|
| £80-85K |
0.52% |
0.46% |
113.10 |
|
| £85-90K |
0.42% |
0.37% |
112.74 |
|
| £90-95K |
0.34% |
0.31% |
112.33 |
|
| £95-100K |
0.28% |
0.25% |
111.89 |
|
| £100K + |
1.45% |
1.34% |
107.92 |
|
|
|

|


|
1992-1997
|
1997-2001
|
|
|
|
| Con |
-9.86% |
| Lab |
11.44% |
| LD |
-3.51% |
|
| Con |
-1.23% |
| Lab |
-0.72% |
| LD |
2.71% |
|
|
 |
Lindsay Hoyle
Labour hold
|
| Con |
 |
16,644 |
34.71% |
| Lab |
 |
25,088 |
52.32% |
| LD |
 |
5,372 |
11.20% |
| Oth |
 |
848 |
1.77% |
| Maj |
 |
8,444 |
17.61% |
| Turn |
 |
47,952 |
62.25% |
|
|
 |
Lindsay Hoyle
Labour hold
|
| C |
Peter Booth |
16,644 |
34.71% |
| LD |
Stephen Fenn |
5,372 |
11.20% |
| UK |
Graham Frost |
848 |
1.77% |
| L |
Lindsay Hoyle |
25,088 |
52.32% |
|
Candidates representing 4 parties stood for election to this seat.
|
|
 |
Lindsay Hoyle
Labour gain
|
| Con |
 |
20,737 |
35.94% |
| Lab |
 |
30,607 |
53.04% |
| LD |
 |
4,900 |
8.49% |
| Ref |
 |
1,319 |
2.29% |
| Oth |
 |
143 |
0.25% |
| Maj |
 |
9,870 |
17.10% |
| Turn |
 |
57,706 |
77.58% |
|
|
 |
|
Conservative
|
| Con |
 |
27,752 |
45.80% |
| Lab |
 |
25,228 |
41.60% |
| LD |
 |
7,249 |
12.00% |
| Oth |
 |
373 |
0.60% |
| Maj |
 |
2,524 |
4.20% |
| Turn |
 |
60,602 |
82.41% |
|
|
 |
|

|

