|
Christchurch
Conservative hold

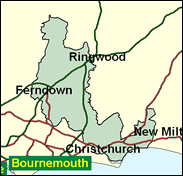
The only one of the Liberal Democrat by-election gains in the so-called M3 corridor (not that it gets this far) to be reversed in 1997 was Christchurch, which is effectively a suburban area of east Dorset between Bournemouth and the New Forest. This is scarcely surprising if the demographics are considered. The housing structure of the seat is unique. Not only is a massive 85pc owner occupied, but 55pc of the housing is detached, the highest proportion of any seat in the United Kingdom. There was very little non-Conservative tradition even in local government. One other striking statistic. 60.9 pc of the electorate in Christchurch is aged over 50, the highest of any seat in the UK - and given differential turnout, the proportion of actual voters of mature years will be considerably higher still. Only in the middle of an eight year period when the Conservatives lost every single byelection they defended could Christchurch have fallen in the first place, and that aberrant time is now past.

Christopher Chope, beaten at Southampton Itchen in 1992, was returned here in 1997, ousting the Liberal by-election winner, Diana Maddock. A hardline Thatcherite, he was born in 1947, and educated at Marlborough and St Andrew’s University. He helped create the Tories’ iconic borough of Wandsworth by selling off its council houses and services, before becoming an MP in 1983. With a stiff, boy scout manner and a taste for rottweilers, as junior local government minister he piloted the poll tax and tried to stop its abolition in 1991. In 1997 he backed Michael Howard as leader but was still brought to the front bench (at least for two years). Dorothy Webb runs here as the tactical vote-seeking Liberal Democrat. Born in 1949, educated at Hornchurch Grammar and Aberystwyth University, she comes with the varied background of military police officer, careers adviser and software specialist.
 |
| Wealthy Achievers, Suburban Areas |
20.68% |
14.99% |
137.92 |
|
| Affluent Greys, Rural Communities |
1.17% |
2.13% |
54.81 |
|
| Prosperous Pensioners, Retirement Areas |
41.89% |
2.49% |
1,684.93 |
|
| Affluent Executives, Family Areas |
1.95% |
4.43% |
44.14 |
|
| Well-Off Workers, Family Areas |
4.92% |
7.27% |
67.65 |
|
| Affluent Urbanites, Town & City Areas |
0.09% |
2.56% |
3.60 |
|
| Prosperous Professionals, Metropolitan Areas |
0.00% |
2.04% |
0.00 |
|
| Better-Off Executives, Inner City Areas |
0.00% |
3.94% |
0.00 |
|
| Comfortable Middle Agers, Mature Home Owning Areas |
13.40% |
13.04% |
102.80 |
|
| Skilled Workers, Home Owning Areas |
3.00% |
12.70% |
23.64 |
|
| New Home Owners, Mature Communities |
6.04% |
8.14% |
74.15 |
|
| White Collar Workers, Better-Off Multi Ethnic Areas |
0.92% |
4.02% |
22.76 |
|
| Older People, Less Prosperous Areas |
0.84% |
3.19% |
26.44 |
|
| Council Estate Residents, Better-Off Homes |
4.48% |
11.31% |
39.58 |
|
| Council Estate Residents, High Unemployment |
0.45% |
3.06% |
14.69 |
|
| Council Estate Residents, Greatest Hardship |
0.17% |
2.52% |
6.70 |
|
| People in Multi-Ethnic, Low-Income Areas |
0.00% |
2.10% |
0.00 |
|
| Unclassified |
0.00% |
0.06% |
0.00 |
|
|
 |
 |
 |
| £0-5K |
9.38% |
9.41% |
99.61 |
|
| £5-10K |
17.57% |
16.63% |
105.62 |
|
| £10-15K |
17.83% |
16.58% |
107.53 |
|
| £15-20K |
14.50% |
13.58% |
106.77 |
|
| £20-25K |
10.86% |
10.39% |
104.48 |
|
| £25-30K |
7.88% |
7.77% |
101.39 |
|
| £30-35K |
5.67% |
5.79% |
97.94 |
|
| £35-40K |
4.09% |
4.33% |
94.36 |
|
| £40-45K |
2.97% |
3.27% |
90.82 |
|
| £45-50K |
2.17% |
2.48% |
87.39 |
|
| £50-55K |
1.60% |
1.90% |
84.12 |
|
| £55-60K |
1.19% |
1.47% |
81.03 |
|
| £60-65K |
0.90% |
1.15% |
78.13 |
|
| £65-70K |
0.68% |
0.91% |
75.41 |
|
| £70-75K |
0.52% |
0.72% |
72.87 |
|
| £75-80K |
0.41% |
0.57% |
70.49 |
|
| £80-85K |
0.32% |
0.46% |
68.26 |
|
| £85-90K |
0.25% |
0.37% |
66.18 |
|
| £90-95K |
0.20% |
0.31% |
64.24 |
|
| £95-100K |
0.16% |
0.25% |
62.41 |
|
| £100K + |
0.72% |
1.34% |
53.21 |
|
|
|

|


|
1992-1997
|
1997-2001
|
|
|
|
| Con |
-17.37% |
| Lab |
-5.19% |
| LD |
19.18% |
|
| Con |
8.66% |
| Lab |
8.23% |
| LD |
-14.82% |
|
|
 |
Christopher Chope
Conservative hold
|
| Con |
 |
27,306 |
55.09% |
| Lab |
 |
7,506 |
15.14% |
| LD |
 |
13,762 |
27.76% |
| Oth |
 |
993 |
2.00% |
| Maj |
 |
13,544 |
27.32% |
| Turn |
 |
49,567 |
67.44% |
|
|
 |
Christopher Chope
Conservative hold
|
| L |
Judith Begg |
7,506 |
15.14% |
| C |
Christopher Chope |
27,306 |
55.09% |
| UK |
Margaret Strange |
993 |
2.00% |
| LD |
Dorothy Webb |
13,762 |
27.76% |
|
Candidates representing 4 parties stood for election to this seat.
|
|
 |
Christopher Chope
Conservative
|
| Con |
 |
26,095 |
46.43% |
| Lab |
 |
3,884 |
6.91% |
| LD |
 |
23,930 |
42.58% |
| Ref |
 |
1,684 |
3.00% |
| Oth |
 |
606 |
1.08% |
| Maj |
 |
2,165 |
3.85% |
| Turn |
 |
56,199 |
78.61% |
|
|
 |
|
Conservative
|
| Con |
 |
35,237 |
63.80% |
| Lab |
 |
6,678 |
12.10% |
| LD |
 |
12,913 |
23.40% |
| Oth |
 |
418 |
0.80% |
| Maj |
 |
22,324 |
40.40% |
| Turn |
 |
55,246 |
80.82% |
|
|
 |
|

|

