|
Cities of London & Westminster
Conservative hold

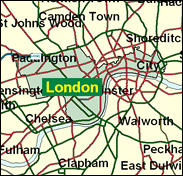
This plum seat (both because of its safeness for the Conservatives and because of its location) will be passed on by the urbane Peter Brooke to Mark Field, who cut his teeth last time when he failed to defend the far more suburban outer-edge London seat of Enfield North in 1997. New Labour might continue to govern Britain, but it cannot claim as its own the seat which contains the Tower of London and Buckingham Palace, Piccadilly Circus and Trafalgar Square, the West End and Mayfair, St Paul's Cathedral and Westminster Abbey - and the Houses of Parliament themselves.

With the retreat of the dated patrician figure of Peter Brooke, the Conservatives have selected Mark Field, born 1964 and educated at Reading School, St Edmund Hall Oxford and Chester Law College. Possessor of a somewhat manic smile, a former solicitor who now runs his own employment agency, he fought and lost Tory-held Enfield North in 1997, comparing his defeat favourably with that of sitting Tory MPs in the same area.
 |
| Wealthy Achievers, Suburban Areas |
0.01% |
14.99% |
0.05 |
|
| Affluent Greys, Rural Communities |
2.35% |
2.13% |
110.66 |
|
| Prosperous Pensioners, Retirement Areas |
0.71% |
2.49% |
28.39 |
|
| Affluent Executives, Family Areas |
0.71% |
4.43% |
16.03 |
|
| Well-Off Workers, Family Areas |
0.19% |
7.27% |
2.59 |
|
| Affluent Urbanites, Town & City Areas |
15.53% |
2.56% |
605.60 |
|
| Prosperous Professionals, Metropolitan Areas |
5.92% |
2.04% |
289.91 |
|
| Better-Off Executives, Inner City Areas |
60.05% |
3.94% |
1,522.80 |
|
| Comfortable Middle Agers, Mature Home Owning Areas |
0.44% |
13.04% |
3.37 |
|
| Skilled Workers, Home Owning Areas |
0.15% |
12.70% |
1.20 |
|
| New Home Owners, Mature Communities |
0.03% |
8.14% |
0.40 |
|
| White Collar Workers, Better-Off Multi Ethnic Areas |
1.57% |
4.02% |
39.02 |
|
| Older People, Less Prosperous Areas |
0.00% |
3.19% |
0.00 |
|
| Council Estate Residents, Better-Off Homes |
0.00% |
11.31% |
0.00 |
|
| Council Estate Residents, High Unemployment |
9.81% |
3.06% |
320.26 |
|
| Council Estate Residents, Greatest Hardship |
0.02% |
2.52% |
0.61 |
|
| People in Multi-Ethnic, Low-Income Areas |
1.40% |
2.10% |
66.49 |
|
| Unclassified |
1.12% |
0.06% |
1,796.31 |
|
|
 |
 |
 |
| £0-5K |
4.16% |
9.41% |
44.18 |
|
| £5-10K |
8.33% |
16.63% |
50.10 |
|
| £10-15K |
10.30% |
16.58% |
62.13 |
|
| £15-20K |
10.41% |
13.58% |
76.66 |
|
| £20-25K |
9.60% |
10.39% |
92.40 |
|
| £25-30K |
8.45% |
7.77% |
108.67 |
|
| £30-35K |
7.24% |
5.79% |
125.04 |
|
| £35-40K |
6.12% |
4.33% |
141.25 |
|
| £40-45K |
5.13% |
3.27% |
157.13 |
|
| £45-50K |
4.28% |
2.48% |
172.59 |
|
| £50-55K |
3.57% |
1.90% |
187.56 |
|
| £55-60K |
2.98% |
1.47% |
202.02 |
|
| £60-65K |
2.49% |
1.15% |
215.97 |
|
| £65-70K |
2.08% |
0.91% |
229.41 |
|
| £70-75K |
1.74% |
0.72% |
242.36 |
|
| £75-80K |
1.46% |
0.57% |
254.83 |
|
| £80-85K |
1.23% |
0.46% |
266.85 |
|
| £85-90K |
1.04% |
0.37% |
278.43 |
|
| £90-95K |
0.88% |
0.31% |
289.61 |
|
| £95-100K |
0.75% |
0.25% |
300.40 |
|
| £100K + |
4.90% |
1.34% |
364.35 |
|
|
|

|


|
1992-1997
|
1997-2001
|
|
|
|
| Con |
-12.03% |
| Lab |
11.01% |
| LD |
-1.82% |
|
| Con |
-0.95% |
| Lab |
-2.04% |
| LD |
3.07% |
|
|
 |
Mark Field
Conservative hold
|
| Con |
 |
15,737 |
46.32% |
| Lab |
 |
11,238 |
33.08% |
| LD |
 |
5,218 |
15.36% |
| Oth |
 |
1,782 |
5.25% |
| Maj |
 |
4,499 |
13.24% |
| Turn |
 |
33,975 |
47.23% |
|
|
 |
Mark Field
Conservative hold
|
| G |
Hugo Charlton |
1,318 |
3.88% |
| C |
Mark Field |
15,737 |
46.32% |
| LD |
Martin Horwood |
5,218 |
15.36% |
| L |
Michael Katz |
11,238 |
33.08% |
| UK |
Colin Merton |
464 |
1.37% |
|
Candidates representing 5 parties stood for election to this seat.
|
|
 |
Peter Brooke
Conservative
|
| Con |
 |
18,981 |
47.27% |
| Lab |
 |
14,100 |
35.11% |
| LD |
 |
4,933 |
12.28% |
| Ref |
 |
1,161 |
2.89% |
| Oth |
 |
980 |
2.44% |
| Maj |
 |
4,881 |
12.16% |
| Turn |
 |
40,155 |
58.16% |
|
|
 |
|
Conservative
|
| Con |
 |
25,512 |
59.30% |
| Lab |
 |
10,368 |
24.10% |
| LD |
 |
6,077 |
14.10% |
| Oth |
 |
1,051 |
2.40% |
| Maj |
 |
15,144 |
35.20% |
| Turn |
 |
43,008 |
65.55% |
|
|
 |
|

|

