|
Clwyd South
Labour hold

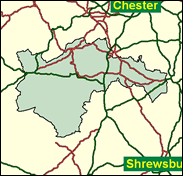
The editor of the Spectator and Telegraph columnist Boris Johnson fought Clwyd South for the Tories in 1997, being blessed with 23pc of the vote to Labour's 58pc; but he will do much better next time; Boris has moved to take over Henley on Thames from Michael Heseltine. This is quite a move. Clwyd South contains a mixture of hill farming and small market towns, some dramatic hill scenery around Llangollen and Corwen, and the very solidly Labour indutrial area around Chirk and Ruabon, which includes former coal mining territory, and chemical plants alongside more modern industrial estates.

Labour’s Martyn Jones, MP here since 1987, is shaggy-haired, bearded and floppy bow-tied, more in the manner of a President of the Royal Academy than of backbench lobby fodder. Tipped off the frontbenches after voting for Prescott, not Blair, in 1994, he claims - as a microbiologist - to have identified the cause of BSE in 1990, and offends against political correctness as a Commons opponent of gun control. Born 1947, educated at Grove Park Grammar School, Wrexham, and a host of polytechnics, he speaks ‘schoolboy Welsh’ in a seat where one in four claim to speak it properly.
 |
| Wealthy Achievers, Suburban Areas |
9.45% |
14.99% |
63.02 |
|
| Affluent Greys, Rural Communities |
12.05% |
2.13% |
566.64 |
|
| Prosperous Pensioners, Retirement Areas |
0.05% |
2.49% |
2.07 |
|
| Affluent Executives, Family Areas |
0.78% |
4.43% |
17.71 |
|
| Well-Off Workers, Family Areas |
6.21% |
7.27% |
85.43 |
|
| Affluent Urbanites, Town & City Areas |
0.00% |
2.56% |
0.00 |
|
| Prosperous Professionals, Metropolitan Areas |
0.00% |
2.04% |
0.00 |
|
| Better-Off Executives, Inner City Areas |
0.00% |
3.94% |
0.00 |
|
| Comfortable Middle Agers, Mature Home Owning Areas |
15.61% |
13.04% |
119.71 |
|
| Skilled Workers, Home Owning Areas |
13.87% |
12.70% |
109.22 |
|
| New Home Owners, Mature Communities |
17.53% |
8.14% |
215.22 |
|
| White Collar Workers, Better-Off Multi Ethnic Areas |
1.32% |
4.02% |
32.72 |
|
| Older People, Less Prosperous Areas |
5.67% |
3.19% |
177.96 |
|
| Council Estate Residents, Better-Off Homes |
14.79% |
11.31% |
130.74 |
|
| Council Estate Residents, High Unemployment |
0.30% |
3.06% |
9.72 |
|
| Council Estate Residents, Greatest Hardship |
2.38% |
2.52% |
94.34 |
|
| People in Multi-Ethnic, Low-Income Areas |
0.00% |
2.10% |
0.00 |
|
| Unclassified |
0.00% |
0.06% |
0.00 |
|
|
 |
 |
 |
| £0-5K |
11.15% |
9.41% |
118.45 |
|
| £5-10K |
19.20% |
16.63% |
115.44 |
|
| £10-15K |
18.29% |
16.58% |
110.33 |
|
| £15-20K |
14.24% |
13.58% |
104.83 |
|
| £20-25K |
10.32% |
10.39% |
99.31 |
|
| £25-30K |
7.31% |
7.77% |
93.96 |
|
| £30-35K |
5.15% |
5.79% |
88.91 |
|
| £35-40K |
3.65% |
4.33% |
84.21 |
|
| £40-45K |
2.61% |
3.27% |
79.90 |
|
| £45-50K |
1.89% |
2.48% |
75.96 |
|
| £50-55K |
1.38% |
1.90% |
72.39 |
|
| £55-60K |
1.02% |
1.47% |
69.16 |
|
| £60-65K |
0.76% |
1.15% |
66.23 |
|
| £65-70K |
0.58% |
0.91% |
63.58 |
|
| £70-75K |
0.44% |
0.72% |
61.17 |
|
| £75-80K |
0.34% |
0.57% |
58.97 |
|
| £80-85K |
0.26% |
0.46% |
56.97 |
|
| £85-90K |
0.21% |
0.37% |
55.13 |
|
| £90-95K |
0.16% |
0.31% |
53.45 |
|
| £95-100K |
0.13% |
0.25% |
51.89 |
|
| £100K + |
0.60% |
1.34% |
44.48 |
|
|
|

|


|
1992-1997
|
1997-2001
|
|
|
|
| Con |
-7.12% |
| Lab |
8.35% |
| LD |
-1.75% |
| PC |
-1.65% |
|
| Con |
1.75% |
| Lab |
-6.75% |
| LD |
0.87% |
| PC |
5.54% |
|
|
 |
Martyn Jones
Labour hold
|
| Con |
 |
8,319 |
24.84% |
| Lab |
 |
17,217 |
51.40% |
| LD |
 |
3,426 |
10.23% |
| PC |
 |
3,982 |
11.89% |
| Oth |
 |
552 |
1.65% |
| Maj |
 |
8,898 |
26.56% |
| Turn |
 |
33,496 |
62.40% |
|
|
 |
Martyn Jones
Labour hold
|
| C |
Tom Biggins |
8,319 |
24.84% |
| PC |
Dyfed Edwards |
3,982 |
11.89% |
| LD |
David Griffiths |
3,426 |
10.23% |
| L |
Martyn Jones |
17,217 |
51.40% |
| UK |
Edwina Theunissen |
552 |
1.65% |
|
Candidates representing 5 parties stood for election to this seat.
|
|
 |
Martyn Jones
Labour
|
| Con |
 |
9,091 |
23.08% |
| Lab |
 |
22,901 |
58.15% |
| LD |
 |
3,684 |
9.35% |
| PC |
 |
2,500 |
6.35% |
| Ref |
 |
1,207 |
3.06% |
| Oth |
|
0 |
0.00% |
| Maj |
 |
13,810 |
35.07% |
| Turn |
 |
39,383 |
73.62% |
|
|
 |
|
Labour
|
| Con |
 |
12,897 |
30.20% |
| Lab |
 |
21,229 |
49.80% |
| LD |
 |
4,727 |
11.10% |
| PC |
 |
3,394 |
8.00% |
| Oth |
 |
390 |
0.90% |
| Maj |
 |
8,332 |
19.50% |
| Turn |
 |
42,637 |
79.01% |
|
|
 |
|

|

