|
Clwyd West
Labour hold

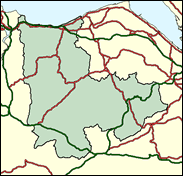
A new constituency in 1997, Clwyd West in North Wales was expected to prove one of the strongest for the Conservatives in the whole of the principality; yet the sitting Clwyd NW MP, Rod Richards, a man who had brushed with the law on the odd occasion, was defeated like all his fellow Conservatives west of the border. Labour won again in the 1999 Welsh Assembly elections, although their three-figure majority suggests that this would be one of the two most vulnerable seats to a Tory revival. The largest town here is Colwyn Bay, the largest employing 'industry' tourism, the predominant language English, the historic party Conservative, the current incumbents New Labour, the future - highly uncertain.

Labour could lose both its MPs called ‘Gareth Thomas’, the one elected here being slightly less vulnerable to a small swing than his Harrow namesake. A barrister, born 1954, educated at Rock Ferry High School, Birkenhead, and Aberystwyth University, he favours devolution, but like the Euro-sceptics Ted Rowlands and Denzil Davies, he accepts the reality of Wales’s financial dependence on England. His political nemesis in the Tories’ No 1 target seat in Wales is Jimmy James, who came to public notice as the personable Tory candidate in the SE Staffs byelection of 1996. Born 1952, and educated at Marlborough, Sandhurst and Birmingham University, he has been a Northamptonshire-based businessman and county councillor for some years, and is currently a fund-raiser.
 |
| Wealthy Achievers, Suburban Areas |
16.96% |
14.99% |
113.13 |
|
| Affluent Greys, Rural Communities |
12.28% |
2.13% |
577.39 |
|
| Prosperous Pensioners, Retirement Areas |
19.08% |
2.49% |
767.48 |
|
| Affluent Executives, Family Areas |
1.41% |
4.43% |
31.76 |
|
| Well-Off Workers, Family Areas |
3.90% |
7.27% |
53.67 |
|
| Affluent Urbanites, Town & City Areas |
1.12% |
2.56% |
43.68 |
|
| Prosperous Professionals, Metropolitan Areas |
0.00% |
2.04% |
0.00 |
|
| Better-Off Executives, Inner City Areas |
4.85% |
3.94% |
122.92 |
|
| Comfortable Middle Agers, Mature Home Owning Areas |
21.20% |
13.04% |
162.59 |
|
| Skilled Workers, Home Owning Areas |
3.42% |
12.70% |
26.91 |
|
| New Home Owners, Mature Communities |
8.88% |
8.14% |
109.09 |
|
| White Collar Workers, Better-Off Multi Ethnic Areas |
0.21% |
4.02% |
5.10 |
|
| Older People, Less Prosperous Areas |
2.44% |
3.19% |
76.54 |
|
| Council Estate Residents, Better-Off Homes |
2.98% |
11.31% |
26.35 |
|
| Council Estate Residents, High Unemployment |
0.00% |
3.06% |
0.00 |
|
| Council Estate Residents, Greatest Hardship |
1.25% |
2.52% |
49.66 |
|
| People in Multi-Ethnic, Low-Income Areas |
0.00% |
2.10% |
0.00 |
|
| Unclassified |
0.03% |
0.06% |
41.41 |
|
|
 |
 |
 |
| £0-5K |
10.87% |
9.41% |
115.48 |
|
| £5-10K |
19.04% |
16.63% |
114.50 |
|
| £10-15K |
18.25% |
16.58% |
110.06 |
|
| £15-20K |
14.14% |
13.58% |
104.12 |
|
| £20-25K |
10.20% |
10.39% |
98.17 |
|
| £25-30K |
7.21% |
7.77% |
92.77 |
|
| £30-35K |
5.10% |
5.79% |
88.02 |
|
| £35-40K |
3.63% |
4.33% |
83.89 |
|
| £40-45K |
2.62% |
3.27% |
80.29 |
|
| £45-50K |
1.91% |
2.48% |
77.14 |
|
| £50-55K |
1.42% |
1.90% |
74.37 |
|
| £55-60K |
1.06% |
1.47% |
71.94 |
|
| £60-65K |
0.80% |
1.15% |
69.78 |
|
| £65-70K |
0.62% |
0.91% |
67.85 |
|
| £70-75K |
0.48% |
0.72% |
66.14 |
|
| £75-80K |
0.37% |
0.57% |
64.59 |
|
| £80-85K |
0.29% |
0.46% |
63.21 |
|
| £85-90K |
0.23% |
0.37% |
61.95 |
|
| £90-95K |
0.19% |
0.31% |
60.81 |
|
| £95-100K |
0.15% |
0.25% |
59.77 |
|
| £100K + |
0.74% |
1.34% |
55.11 |
|
|
|

|


|
1992-1997
|
1997-2001
|
|
|
|
| Con |
-16.03% |
| Lab |
6.16% |
| LD |
-2.90% |
| PC |
8.87% |
|
| Con |
3.11% |
| Lab |
1.75% |
| LD |
-1.43% |
|
|
 |
Gareth Thomas
Labour hold
|
| Con |
 |
12,311 |
35.58% |
| Lab |
 |
13,426 |
38.80% |
| LD |
 |
3,934 |
11.37% |
| PC |
 |
4,453 |
12.87% |
| Oth |
 |
476 |
1.38% |
| Maj |
 |
1,115 |
3.22% |
| Turn |
 |
34,600 |
64.12% |
|
|
 |
Gareth Thomas
Labour hold
|
| LD |
Bobbie Feeley |
3,934 |
11.37% |
| UK |
Matthew Guest |
476 |
1.38% |
| C |
Jimmy James |
12,311 |
35.58% |
| L |
Gareth Thomas |
13,426 |
38.80% |
| PC |
Elfed Williams |
4,453 |
12.87% |
|
Candidates representing 5 parties stood for election to this seat.
|
|
 |
Gareth Thomas
Labour gain
|
| Con |
 |
13,070 |
32.47% |
| Lab |
 |
14,918 |
37.06% |
| LD |
 |
5,151 |
12.80% |
| PC |
 |
5,421 |
13.47% |
| Ref |
 |
1,114 |
2.77% |
| Oth |
 |
583 |
1.45% |
| Maj |
 |
1,848 |
4.59% |
| Turn |
 |
40,257 |
75.29% |
|
|
 |
|
Conservative
|
| Con |
 |
20,132 |
48.50% |
| Lab |
 |
12,819 |
30.90% |
| LD |
 |
6,526 |
15.70% |
| PC |
 |
1,906 |
4.60% |
| Oth |
 |
151 |
0.40% |
| Maj |
 |
7,313 |
17.60% |
| Turn |
 |
41,534 |
77.16% |
|
|
 |
|

|

