|
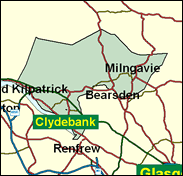
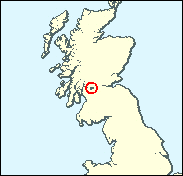
Clydebank & Milngavie
Labour hold

Although no longer famed for shipbuilding as it used to be Clydebank remains a name redolent of the area's heavy industrial heritage, and the image of "red Clydeside" is maintained in paler form by Labour's continued dominance here, even if their recent MPs have hardly shared the politics of Jimmy Maxton or even Jimmy Reid, the Upper Clyde Shipbuilders trade unionist who polled nearly 6,000 votes as recently as February 1974 as a Communist, opposing the closure of the shipyards.

Tony Worthington, one of five Englishmen in Scottish Labour-held seats, is one of Blair’s ministerial rejects, sacked after one year of workmanlike service at the Northern Ireland Office. Tall, grey and once-targeted by Scots racists, he is an uncharismatic expert on foreign aid and human rights issues. He was born in 1941, educated at City of Lincoln, LSE and other universities, worked as a sociology lecturer at Jordanhill Education College in Glasgow, sat for long enough (13 years) on Strathclyde Council and inherited the seat in 1987. He has campaigned for asbestos compensation.
 |
| Wealthy Achievers, Suburban Areas |
14.99% |
14.99% |
100.01 |
|
| Affluent Greys, Rural Communities |
0.00% |
2.13% |
0.00 |
|
| Prosperous Pensioners, Retirement Areas |
2.26% |
2.49% |
91.01 |
|
| Affluent Executives, Family Areas |
6.54% |
4.43% |
147.85 |
|
| Well-Off Workers, Family Areas |
8.58% |
7.27% |
118.02 |
|
| Affluent Urbanites, Town & City Areas |
1.46% |
2.56% |
56.74 |
|
| Prosperous Professionals, Metropolitan Areas |
0.86% |
2.04% |
42.25 |
|
| Better-Off Executives, Inner City Areas |
0.99% |
3.94% |
25.08 |
|
| Comfortable Middle Agers, Mature Home Owning Areas |
3.30% |
13.04% |
25.32 |
|
| Skilled Workers, Home Owning Areas |
2.28% |
12.70% |
17.91 |
|
| New Home Owners, Mature Communities |
5.36% |
8.14% |
65.84 |
|
| White Collar Workers, Better-Off Multi Ethnic Areas |
0.37% |
4.02% |
9.29 |
|
| Older People, Less Prosperous Areas |
5.87% |
3.19% |
184.39 |
|
| Council Estate Residents, Better-Off Homes |
20.44% |
11.31% |
180.72 |
|
| Council Estate Residents, High Unemployment |
13.47% |
3.06% |
439.94 |
|
| Council Estate Residents, Greatest Hardship |
13.21% |
2.52% |
524.54 |
|
| People in Multi-Ethnic, Low-Income Areas |
0.00% |
2.10% |
0.00 |
|
| Unclassified |
0.00% |
0.06% |
0.00 |
|
|
 |
|
|
| £0-5K |
10.27% |
9.41% |
109.13 |
|
| £5-10K |
17.28% |
16.63% |
103.86 |
|
| £10-15K |
16.46% |
16.58% |
99.30 |
|
| £15-20K |
13.13% |
13.58% |
96.68 |
|
| £20-25K |
9.94% |
10.39% |
95.64 |
|
| £25-30K |
7.44% |
7.77% |
95.74 |
|
| £30-35K |
5.59% |
5.79% |
96.54 |
|
| £35-40K |
4.23% |
4.33% |
97.74 |
|
| £40-45K |
3.24% |
3.27% |
99.14 |
|
| £45-50K |
2.50% |
2.48% |
100.57 |
|
| £50-55K |
1.94% |
1.90% |
101.95 |
|
| £55-60K |
1.52% |
1.47% |
103.22 |
|
| £60-65K |
1.20% |
1.15% |
104.36 |
|
| £65-70K |
0.95% |
0.91% |
105.34 |
|
| £70-75K |
0.76% |
0.72% |
106.16 |
|
| £75-80K |
0.61% |
0.57% |
106.83 |
|
| £80-85K |
0.50% |
0.46% |
107.35 |
|
| £85-90K |
0.40% |
0.37% |
107.73 |
|
| £90-95K |
0.33% |
0.31% |
107.98 |
|
| £95-100K |
0.27% |
0.25% |
108.11 |
|
| £100K + |
1.42% |
1.34% |
105.33 |
|
|
|
|


|
1992-1997
|
1997-2001
|
|
|
|
| Con |
-9.00% |
| Lab |
4.92% |
| LD |
0.95% |
| SNP |
2.64% |
|
| Con |
-1.68% |
| Lab |
-2.13% |
| LD |
1.58% |
| SNP |
-1.06% |
|
|
|
Tony Worthington
Labour hold
|
| Con |
 |
3,514 |
10.82% |
| Lab |
 |
17,249 |
53.09% |
| LD |
 |
3,909 |
12.03% |
| SNP |
 |
6,525 |
20.08% |
| Oth |
 |
1,294 |
3.98% |
| Maj |
 |
10,724 |
33.01% |
| Turn |
|
32,491 |
61.85% |
|
|
|
Tony Worthington
Labour hold
|
| LD |
Rod Ackland |
3,909 |
12.03% |
| SSP |
Dawn Brennan |
1,294 |
3.98% |
| C |
Catherine Pickering |
3,514 |
10.82% |
| L |
Tony Worthington |
17,249 |
53.09% |
| SNP |
Jim Yuill |
6,525 |
20.08% |
|
Candidates representing 5 parties stood for election to this seat.
|
|
|
Tony Worthington
Labour
|
| Con |
|
4,885 |
12.50% |
| Lab |
|
21,583 |
55.22% |
| LD |
|
4,086 |
10.45% |
| SNP |
|
8,263 |
21.14% |
| Ref |
 |
269 |
0.69% |
| Oth |
|
0 |
0.00% |
| Maj |
|
13,320 |
34.08% |
| Turn |
|
39,086 |
75.03% |
|
|
|
|
Labour
|
| Con |
|
8,503 |
21.50% |
| Lab |
|
19,923 |
50.30% |
| LD |
|
3,778 |
9.50% |
| SNP |
|
7,319 |
18.50% |
| Oth |
|
117 |
0.30% |
| Maj |
|
11,420 |
28.80% |
| Turn |
|
39,640 |
77.31% |
|
|
|
|
|