|
Clydesdale
Labour hold

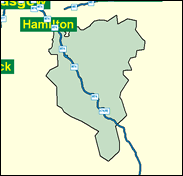
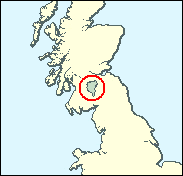
Clydesdale is yet another seat in industrial central Scotland where the result is predictable: Labour first, SNP second, the rest nowhere. This seat is based on the old Lanark, and its politics shaped by the former coalmining area around Lesmahagow and Douglas, along with Carluke and Stonehouse, although Lanark itself has more the area of a county - and almost country town -and the seat stretches across over 100,000 hectares of thinly populated countryside and moorland as far as the isolated little town of Biggar. Carstairs Junction, where the train lines from the south for Glasgow and Edinburgh diverge, is also in the seat. But Clydesdale is on the main and direct line for another scheduled Labour win.

Jimmy Hood, low-slung, barrel-chested and built like a bouncer, is about as wide as he is long, and a collector’s item as one of only 12 ex-NUM-sponsored MPs in a PLP of 418 (in 1997). Born 1948, locally schooled at Lesmahagow and Motherwell Technical College (and later day-release at Nottingham University), he worked for 23 years as a miner, mostly on the Notts coalfield. As a pro-European Commons chairman he has allowed his Campaign Group membership to lapse.
 |
| Wealthy Achievers, Suburban Areas |
9.46% |
14.99% |
63.11 |
|
| Affluent Greys, Rural Communities |
3.82% |
2.13% |
179.86 |
|
| Prosperous Pensioners, Retirement Areas |
1.76% |
2.49% |
70.87 |
|
| Affluent Executives, Family Areas |
5.11% |
4.43% |
115.52 |
|
| Well-Off Workers, Family Areas |
13.89% |
7.27% |
191.01 |
|
| Affluent Urbanites, Town & City Areas |
0.95% |
2.56% |
36.90 |
|
| Prosperous Professionals, Metropolitan Areas |
0.19% |
2.04% |
9.07 |
|
| Better-Off Executives, Inner City Areas |
0.32% |
3.94% |
8.11 |
|
| Comfortable Middle Agers, Mature Home Owning Areas |
6.71% |
13.04% |
51.46 |
|
| Skilled Workers, Home Owning Areas |
6.47% |
12.70% |
50.93 |
|
| New Home Owners, Mature Communities |
8.04% |
8.14% |
98.69 |
|
| White Collar Workers, Better-Off Multi Ethnic Areas |
0.85% |
4.02% |
21.07 |
|
| Older People, Less Prosperous Areas |
5.98% |
3.19% |
187.75 |
|
| Council Estate Residents, Better-Off Homes |
26.76% |
11.31% |
236.60 |
|
| Council Estate Residents, High Unemployment |
4.60% |
3.06% |
150.37 |
|
| Council Estate Residents, Greatest Hardship |
4.92% |
2.52% |
195.26 |
|
| People in Multi-Ethnic, Low-Income Areas |
0.00% |
2.10% |
0.00 |
|
| Unclassified |
0.17% |
0.06% |
268.58 |
|
|
 |
 |
 |
| £0-5K |
9.45% |
9.41% |
100.39 |
|
| £5-10K |
16.30% |
16.63% |
98.03 |
|
| £10-15K |
16.51% |
16.58% |
99.60 |
|
| £15-20K |
13.82% |
13.58% |
101.77 |
|
| £20-25K |
10.75% |
10.39% |
103.48 |
|
| £25-30K |
8.11% |
7.77% |
104.38 |
|
| £30-35K |
6.05% |
5.79% |
104.47 |
|
| £35-40K |
4.50% |
4.33% |
103.85 |
|
| £40-45K |
3.35% |
3.27% |
102.69 |
|
| £45-50K |
2.51% |
2.48% |
101.14 |
|
| £50-55K |
1.89% |
1.90% |
99.31 |
|
| £55-60K |
1.43% |
1.47% |
97.31 |
|
| £60-65K |
1.10% |
1.15% |
95.21 |
|
| £65-70K |
0.84% |
0.91% |
93.07 |
|
| £70-75K |
0.65% |
0.72% |
90.94 |
|
| £75-80K |
0.51% |
0.57% |
88.83 |
|
| £80-85K |
0.40% |
0.46% |
86.77 |
|
| £85-90K |
0.32% |
0.37% |
84.77 |
|
| £90-95K |
0.25% |
0.31% |
82.84 |
|
| £95-100K |
0.20% |
0.25% |
80.98 |
|
| £100K + |
0.95% |
1.34% |
70.64 |
|
|
|

|


|
1992-1997
|
1997-2001
|
|
|
|
| Con |
-7.11% |
| Lab |
7.94% |
| LD |
0.16% |
| SNP |
-0.97% |
|
| Con |
-3.12% |
| Lab |
-5.91% |
| LD |
2.40% |
| SNP |
4.11% |
|
|
 |
Jimmy Hood
Labour hold
|
| Con |
 |
5,034 |
13.17% |
| Lab |
 |
17,822 |
46.63% |
| LD |
 |
4,111 |
10.76% |
| SNP |
 |
10,028 |
26.24% |
| Oth |
 |
1,227 |
3.21% |
| Maj |
 |
7,794 |
20.39% |
| Turn |
 |
38,222 |
59.33% |
|
|
 |
Jimmy Hood
Labour hold
|
| SSP |
Paul Cochshott |
974 |
2.55% |
| LD |
Moira Craig |
4,111 |
10.76% |
| L |
Jimmy Hood |
17,822 |
46.63% |
| UK |
Donald MacKay |
253 |
0.66% |
| C |
Kevin Newton |
5,034 |
13.17% |
| SNP |
Jim Wright |
10,028 |
26.24% |
|
Candidates representing 6 parties stood for election to this seat.
|
|
 |
Jimmy Hood
Labour
|
| Con |
 |
7,396 |
16.29% |
| Lab |
 |
23,859 |
52.54% |
| LD |
 |
3,796 |
8.36% |
| SNP |
 |
10,050 |
22.13% |
| Ref |
|
0 |
0.00% |
| Oth |
 |
311 |
0.68% |
| Maj |
 |
13,809 |
30.41% |
| Turn |
 |
45,412 |
71.60% |
|
|
 |
|
Labour
|
| Con |
 |
11,231 |
23.40% |
| Lab |
 |
21,418 |
44.60% |
| LD |
 |
3,957 |
8.20% |
| SNP |
 |
11,084 |
23.10% |
| Oth |
 |
342 |
0.70% |
| Maj |
 |
10,187 |
21.20% |
| Turn |
 |
48,032 |
76.63% |
|
|
 |
|

|

